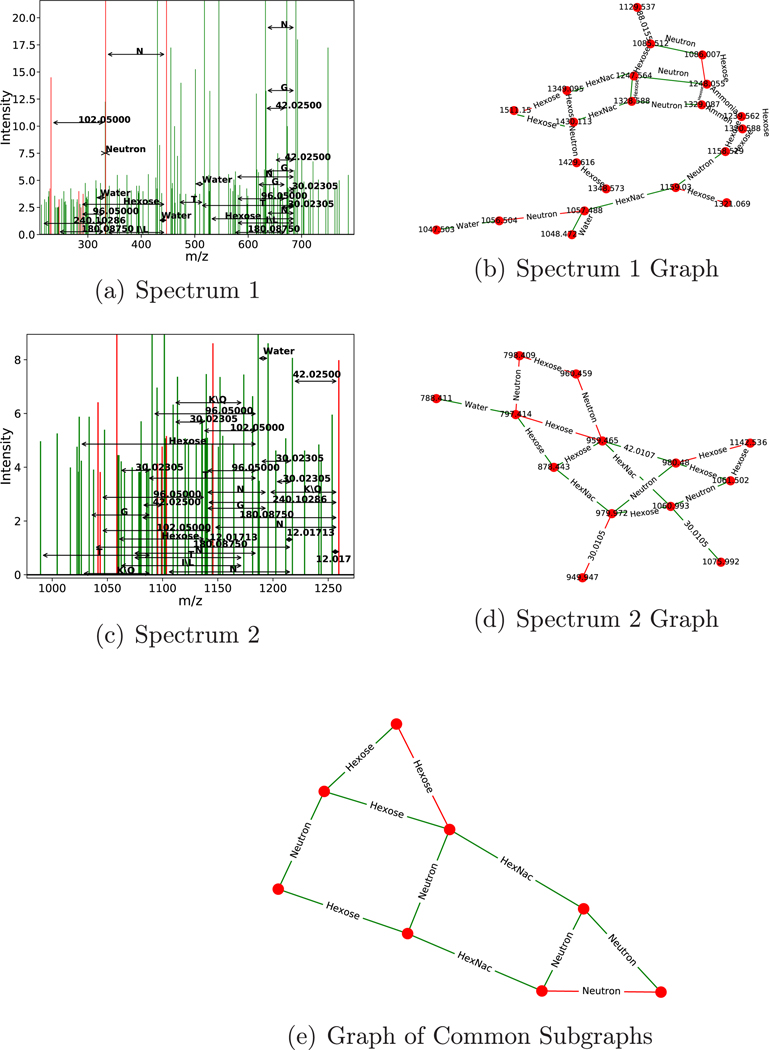
Figure 4.
Example similar subgraph pair found using LSH on results from 62 expert-curated glycoconjugate spectra. Two spectra (a,c) and their corresponding de novo graphs (b,d) found using the combinatorial approach. Spectra are drawn with peaks used in the graph colored red and unused peaks colored green. LSH is used to find this matching pair, and fast convolution finds the largest isomorphic subgraph in the pair (e). A minimal number of peaks were removed from panels b and d for legibility. The top subspectrum is from “120810_JF_HNU142_16.5710.5710.3”, and the bottom is from “120810_JF_HNU142_16.6444.6444.4”.

