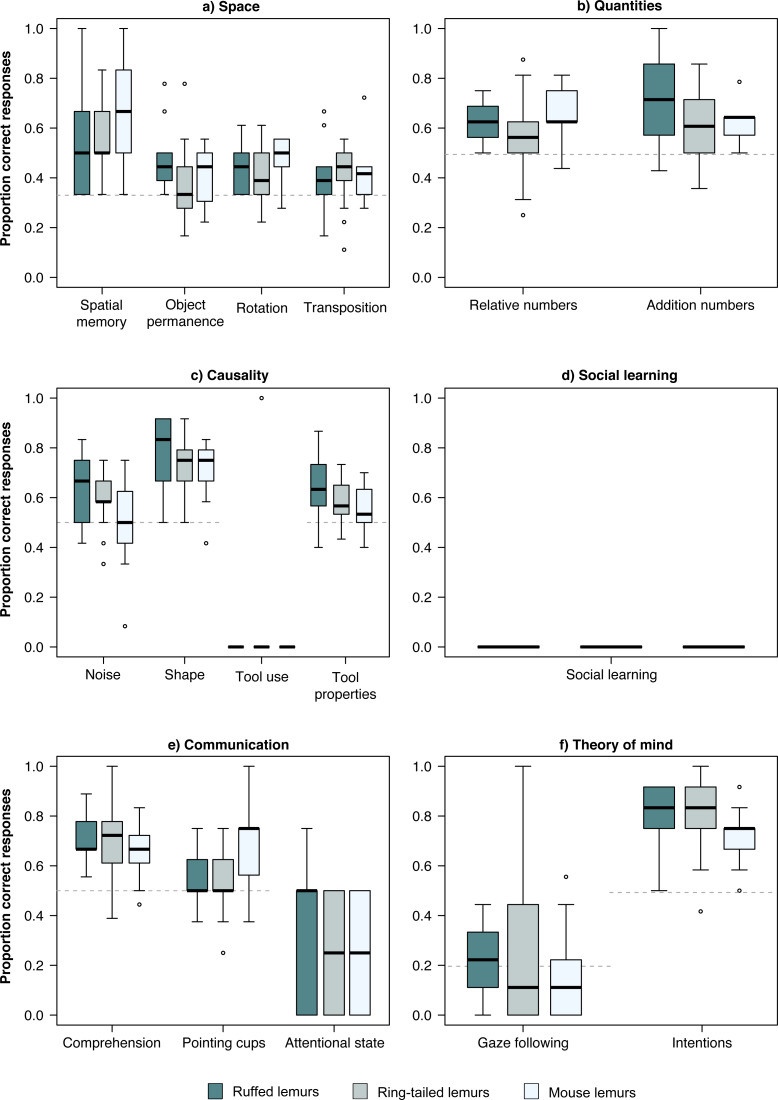
Figure 1. Performance in the PCTB of the three lemur species.
Average performance of the three lemur species in all tasks of the PCTB in the scales (A) Space, (B) Quantities, (C) Causality, (D) Social learning, (E) Communication, and (F) Theory of mind. Represented are medians (black bars), interquartile ranges (boxes), and outliers (circles).

