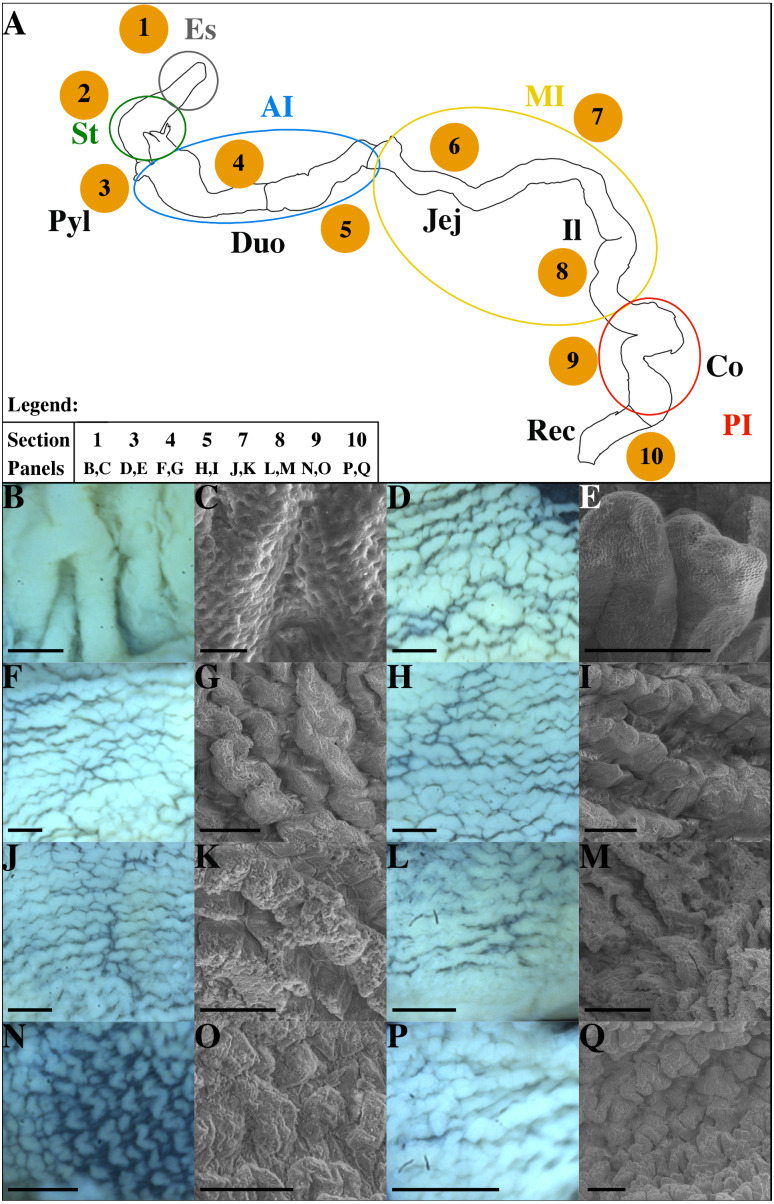
Figure 3. Schematic representation of the GIT in non-infected P. orbicularis (A) and microscopic characterization of sections studied (B–Q).
(A) Numbers 1–10 correspond to sections defined in Fig. 1. Colored circles delimit the functional regions of the GIT. (B–Q) Light and scanning electron microscopy (SEM) pictures of the GIT sections. (B, D, F, H, J, L, N, P) Light microscopy which represent the gut folds, scale bars = 500 µm. (C, E, G, I, K, M, O, Q) SEM pictures, scale bars = 200 µm except for C where the scale bar = 10 µm. (B, C) Section 1. (D, E) Section 3. (F, G) Section 4. (H, I) Section 5. (J, K) Section 7. (L, M) Section 8. (N, O) Section 9. (P, Q) Section 10. AI, Anterior Intestine; Co, Colon; Duo, Duodenum; Es, Esophagus; Il, Ileum; Jej, Jejunum; MI, Medium Intestine; PI, Posterior Intestine; Pyl, pylore; St, stomach; Rec, Rectum.

