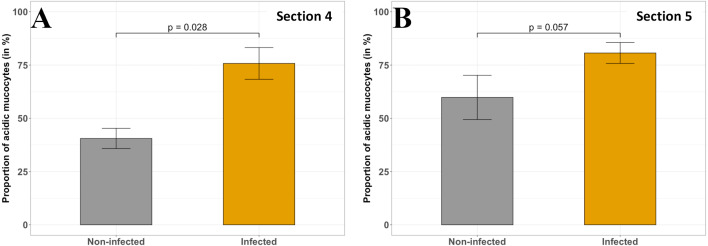
Figure 8. Comparison of the acid mucous cells proportion (in %) in non-infected and infected fish in different sections of P. orbicularis GIT.
(A) section 4, (B) section 5. Measurements have been assessed on slides stained with PAS-AB 2.5. Results of Wilcoxon test (p-value) is indicated for each comparison (α = 0.05, n = 4 per treatment).

