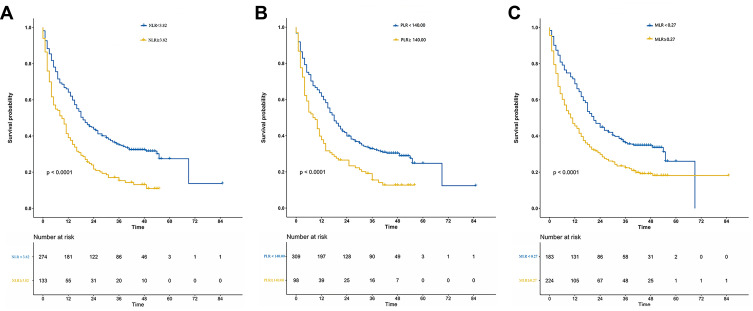
Figure 3.
Kaplan–Meier survival curves for overall survival (OS) in HCC patients after interventional treatments. (A) OS of patients with NLR 3.82 was shorter than those with NLR < 3.82 (p < 0.001, log-rank). (B) OS of patients with PLR
 140.00 was shorter than those with PLR < 140.00 (p < 0.001, log-rank). (C) OS of patients with MLR
  Table 1 Correlation between peripheral NLR, PLR, MLR, and clinical variables of hepatic cancer patients.

