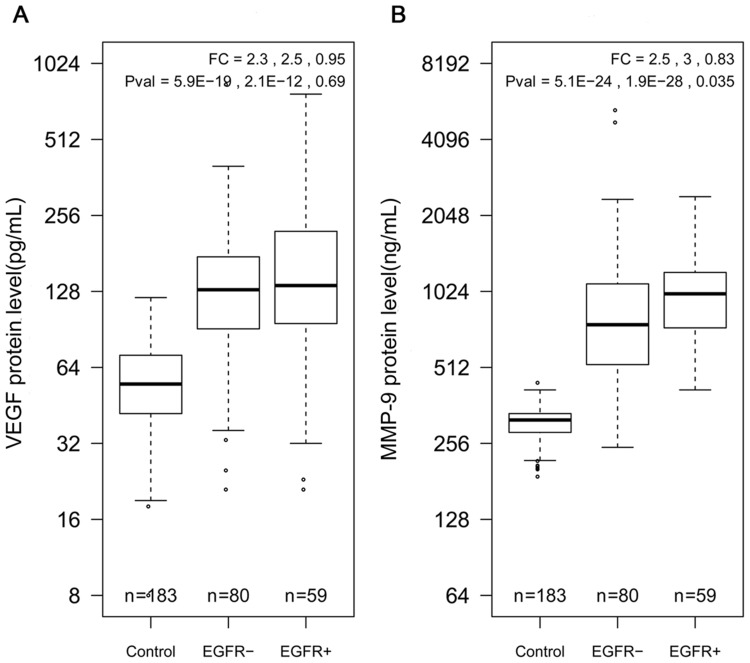
Figure 1.
Boxplots of serum VEGF and MMP-9 in healthy controls, EGFR-negative patients, and EGFR-positive patients. (A) Serum VEGF concentration in three different groups. (B) Serum MMP-9 concentration in three different groups. Fold change and P-values are listed in the order of control vs EGFR-positive patients, and EGFR-negative patients vs EGFR-positive patients.
Abbreviations: EGFR−, EGFR-negative patients with HCC and EGRF+, EGFR-positive patients with HCC.

