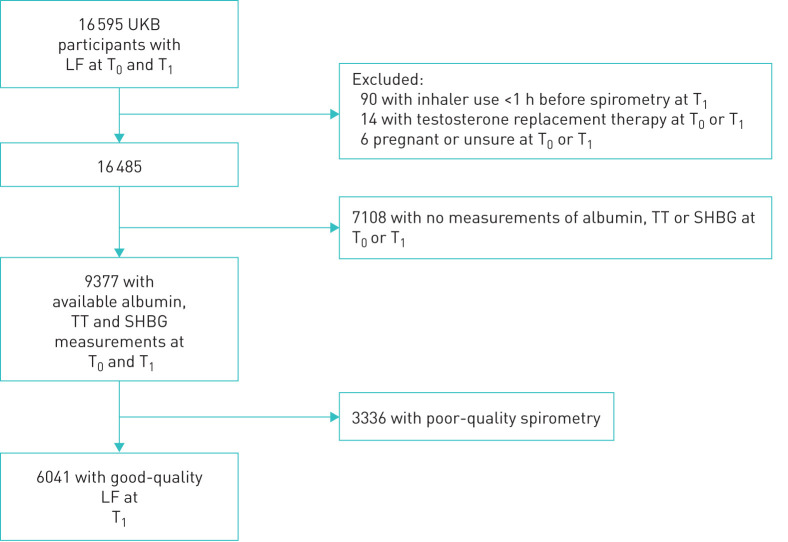
FIGURE 2.
Flow chart of T0 – T1 participants with acceptable and reproducible spirometry at first follow-up (T1, 2012–2013) and available measurements for TT, SHBG and albumin at both baseline (T0, 2006–2010) and T1. LF: lung function; SHBG: sex hormone-binding globulin; TT: total testosterone; UKB: UK Biobank.

