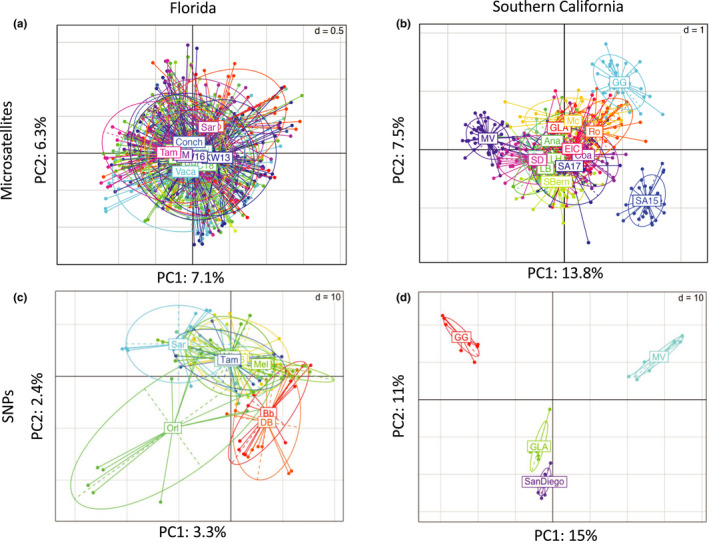
FIGURE 6.

Principal component analysis of microsatellite data for (a) Florida and (b) southern California and of SNP data for (c) Florida and (d) southern California. Ellipses indicate the distribution of individuals within each group. While the Florida populations are overlapping in PC spaces (indicating little genetic structure), the southern California populations are more differentiated. See Table 1 for full names of each site and additional information
