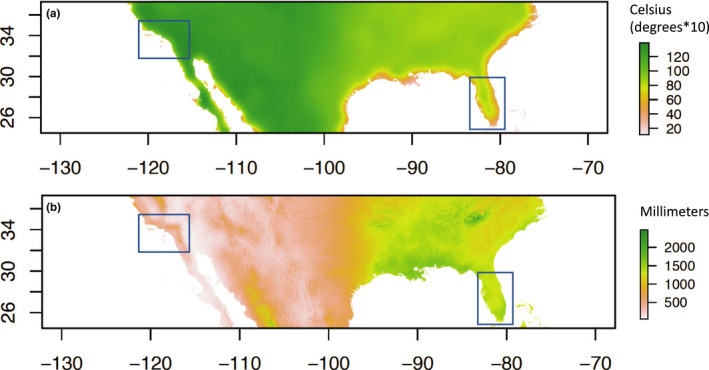
FIGURE 8.

Differences in climate between the two sample regions (boxes) as shown by two examples: (a) daily temperature range and (b) mean annual precipitation. Green shows high temperature range/precipitation, and red shows low temperature range/precipitation. Derived from CHELSA climate data (Karger et al. 2017)
