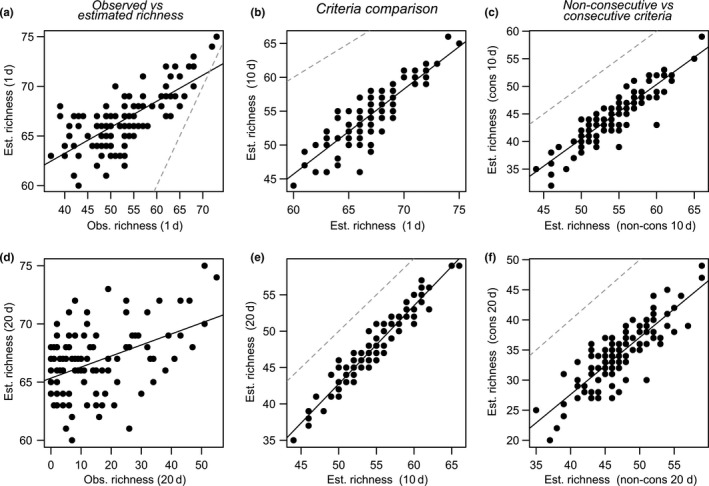
FIGURE 3.

Comparison of correlations between observed and estimated local species richness based using 1 (a) and 20 (d) days as criterion for species inclusion; estimated local species richness (nonconsecutive) based on inclusion criterion 1 versus 10 days (b) and 10 versus 20 days (e); and estimated local richness for nonconsecutive versus consecutive criteria using 10 days (c) and 20 days (f) as inclusion criteria. Solid lines show the normal regression line. Dashed gray lines show the identity line
