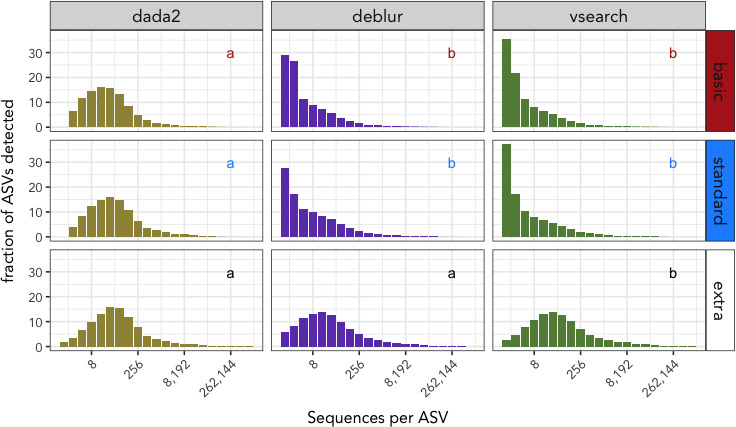
FIGURE 2.

Read abundances per sequence variant among all bat guano samples. The frequency with which ASVs are detected are binned as a power of two (i.e., first bin contains singletons, second bin contains ASVs with 2–3 sequences, third bin contains 4–7 sequences). Distributions of ASV abundances are partitioned by denoising program (vertical facets) and filtering regime (horizontal facets). Letters inset for each subplot reflect statistically significant differences between each denoising group. Note that while per‐sample singleton sequences are initially discarded during raw data processing, singleton sequences can arise in the extra‐filtered dataset because a fixed number of reads was subtracted from every ASV on a per‐sample basis
