
FIGURE 6.
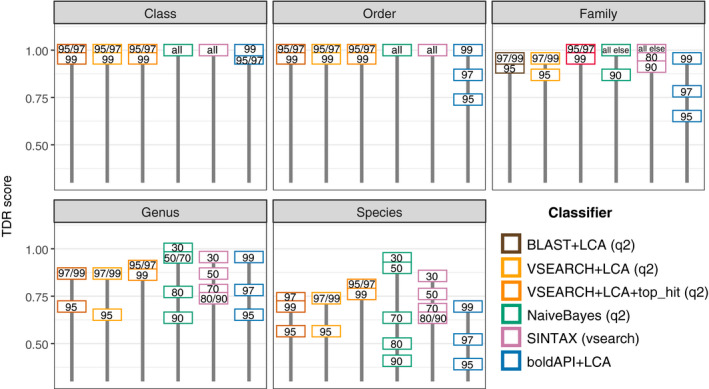
Classifier performance of mock community data as measured by Taxon Discovery Rate (TDR)—higher TDR values indicate a greater fraction of observed taxa that were expected at a particular taxonomic level. Values inside each box indicate the parameter tested for that classifier, with BLAST, VSEARCH, and BOLD values reflecting alignment percent identity, while Naive Bayes and SINTAX values indicate confidence thresholds. Values marked as “all” indicate all possible parameters within classifier tested (30/50/70/80/90 confidence thresholds), while “all else” indicate all other remaining values not specified as integers within the group. The addition of a second parameter that retains only the highest alignment score distinguishes the VSEARCH+LCA and "VSEARCH+LCA+top_hit" classifiers