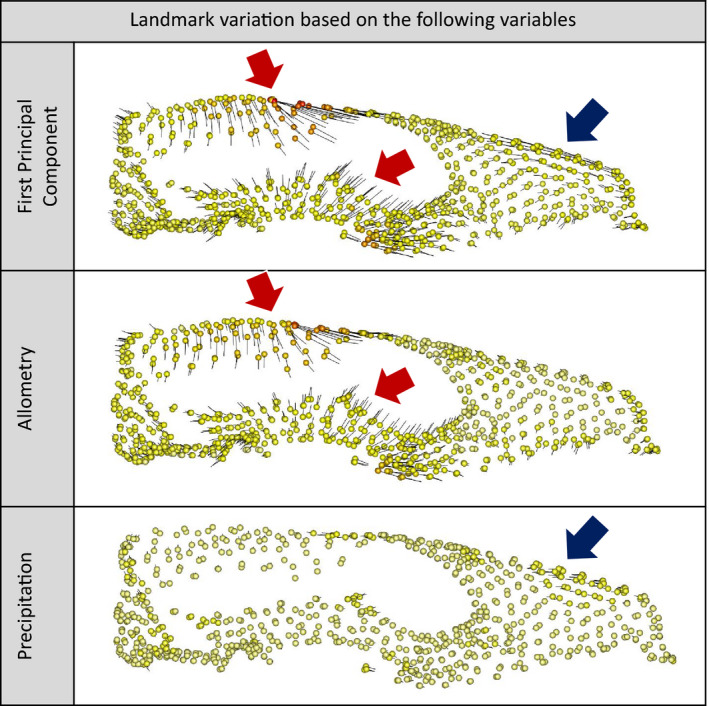
Figure 1.

Shape changes associated with the First Principal Component (above), allometry (middle), and precipitation (below). Spheres are the landmarks used in this study. Warmer colours represent higher landmark variation between minimum and maximum estimated configurations based on the three linear predictors. Black vectors show direction and magnitude of shape variation. Red arrows indicate anatomical zones of major landmark variation associated with allometry. Blue arrow indicates anatomical zone of major landmark variation associated with precipitation
