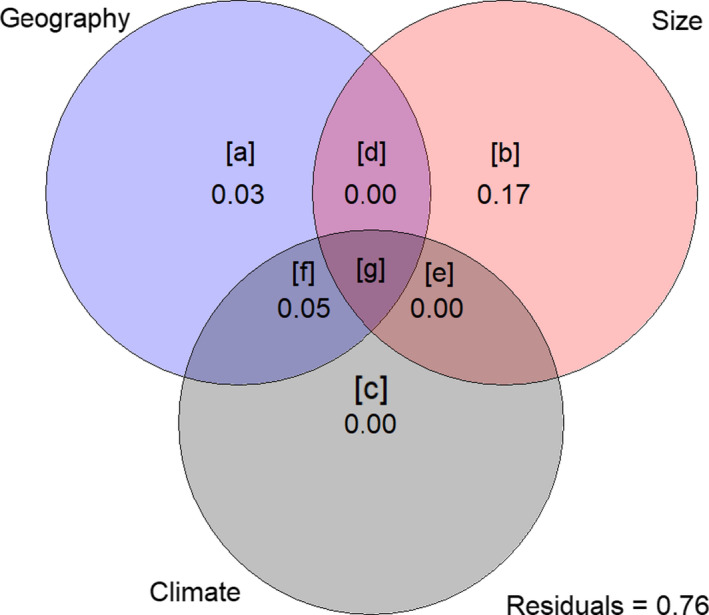
Figure 5.

Schematic representation of the variation partitioning analysis (VARPART), which included effect of geography, size and combined climatic variables (precipitation and temperature) on cranial shape of mainland specimens. The values shown in the diagram represent the individual fractions for each set. The outer numbers are the adjusted R 2 values of pure geography [a], pure size [b] and pure climate [c] and the inner values are the adjusted R‐squared values of the interaction of the corresponding explanatory variables. The individual fraction for the interaction of all three variables [g] is negligible and not shown. The amount of unexplained shape by this model is depicted by the residuals (76%). Circle sizes are schematic and do not represent the amount of shape explained by the model
