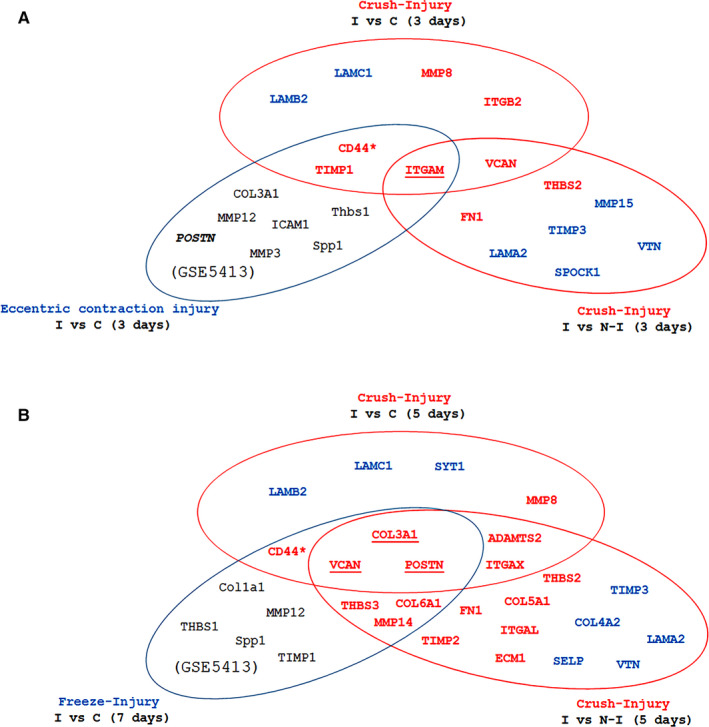
Figure 3.

Venn diagram of the relations between gene profiles at 3 days post‐injury (A) and 5/7 days post‐injury (B). Two sets contain the genes differentially expressed in crushed muscle samples compared to contralateral, non‐injured muscle (I vs N‐I) or samples from control, non‐injured animals (I vs C). The third set contains genes differentially expressed in muscle samples after eccentric contraction or freezing injury compared to samples from control, non‐injured animals
