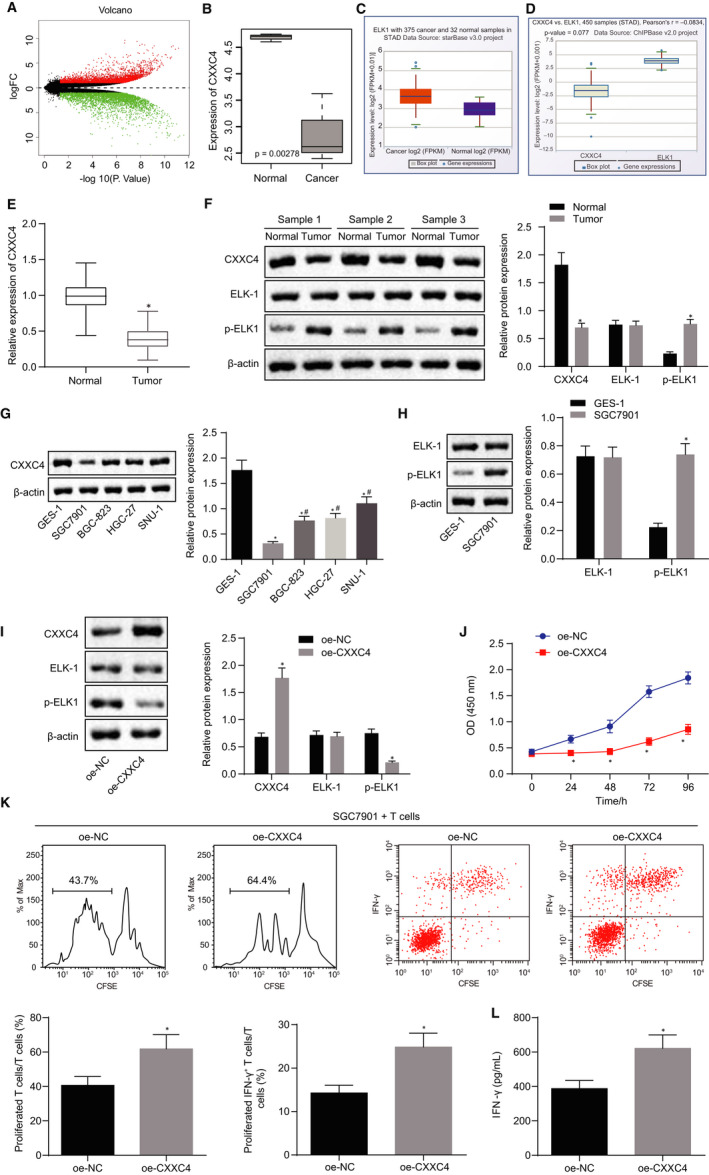
Figure 1.

Overexpressed CXXC4 inhibits the proliferation of gastric cancer cells and promotes the activation of T cells by suppressing the phosphorylation of ELK1. A, Volcano map, the x‐axis represents the different log10 P value, and the y‐axis indicates logFoldChange. Each point on the map represents a gene; red colour represents up‐regulated genes, and green refers to down‐regulated genes in gastric cancer samples. B, The expression box plot of CXXC4 in the gastric cancer microarray dataset GSE49051. The x‐axis represents the sample type, while the y‐axis represents the expression value. C, The expression box plot of ELK1 in gastric cancer in the Starbase database. D, The co‐expression box plot of CXXC4 and ELK1 according to Chipbase E, The expression of CXXC4 in gastric cancer and adjacent normal tissues measured by RT‐qPCR, n = 37. *P < .05 tumour tissues vs adjacent normal tissues. F, The expression of CXXC4, ELK‐1 and p‐ELK1 in gastric cancer and adjacent normal tissues normalized to β‐actin assessed by Western blot analysis, n = 37, *P < .05 tumour tissues vs. adjacent normal tissues. G, The expression of CXXC4 in normal gastric epithelial cell lines GES‐1 and gastric cancer cell lines SGC7901, BGC‐823, SNU‐1, HGC‐27 normalized to β‐actin measured by Western blot analysis, n = 3, *P < .05 SGC7901, BGC‐823, SNU‐1 or HGC‐27 cell line vs GES‐1 cell line, # P < .05 BGC‐823, SNU‐1 or HGC‐27 cell line vs SGC7901 cell line. H, The expression of ELK‐1 and p‐ELK1 in GES‐1 and the gastric cancer cell line SGC7901 normalized to β‐actin and assessed by Western blot, n = 3, *P < .05 SGC7901, BGC‐823, SNU‐1 or HGC‐27 cell line vs GES‐1 cell line, # P < .05 BGC‐823, SNU‐1 or HGC‐27 cell line vs SGC7901 cell line. I, The expression of CXXC4, ELK‐1 and p‐ELK1 in SGC7901 cells normalized to β‐actin after transfection with oe‐NC and oe‐CXXC4 measured by Western blot analysis, n = 3, *P < .05 oe‐CXXC4 vs oe‐NC. J, The proliferation of SGC7901 cells detected by CCK‐8 assay, n = 3, *P < .05 oe‐CXXC4 vs oe‐NC. K, The proliferation of CD3+ T cells and the proportion of activated IFN‐γ+ T cells assessed by flow cytometry, n = 3, *P < .05 oe‐CXXC4 vs oe‐NC. L, The cytokine IFN‐γ secreted by T cells detected by ELISA, n = 3, *P < .05 oe‐CXXC4 vs oe‐NC. Measurement data were expressed as mean ± SD. The data conforming to normal distribution and homogeneous variance between two groups were analysed by paired (for paired data in panels E and F) or unpaired t test (for unpaired data in panels H‐L). Comparisons in panel G among multiple groups were analysed using one‐way ANOVA, followed by Tukey's post hoc test. The data at different time points in panel J were analysed by the repeated measures ANOVA followed by Bonferroni's post hoc test. The experiment was repeated three times independently
