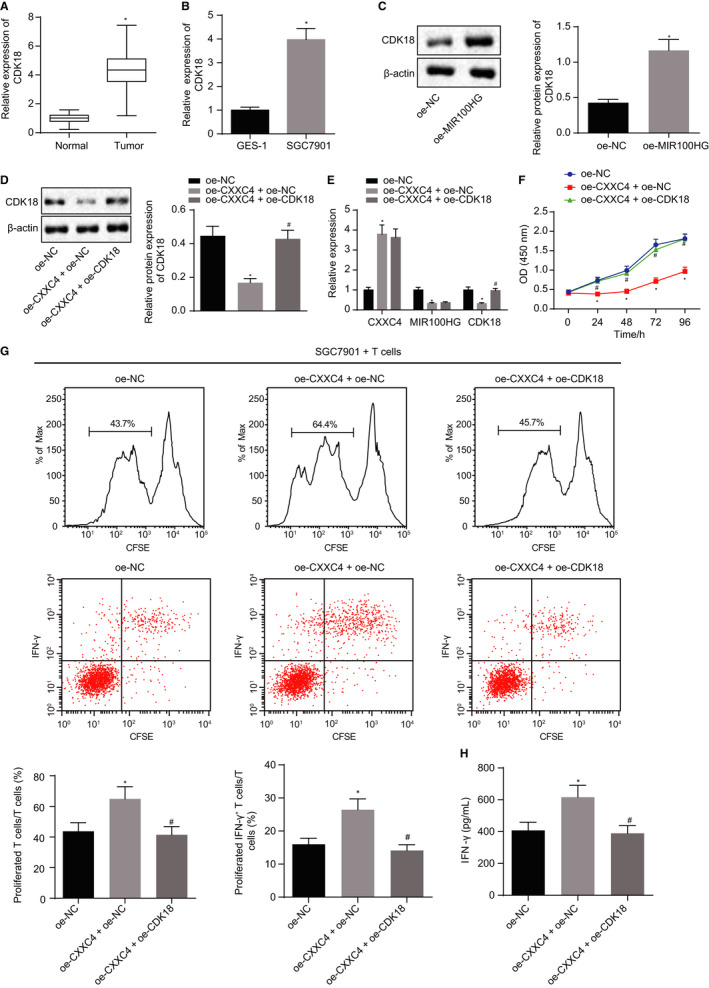
Figure 4.

Enforced expression of CXXC4 leads to suppression of gastric cancer cells proliferation and the activation of T cells by inhibiting the expression of CDK18. A, The expression of CDK18 in gastric cancer and adjacent normal tissues measured by RT‐qPCR, n = 37, *P < .05 tumour tissues vs adjacent normal tissues. B, The expression of CDK18 in GES‐1 and the gastric cancer cell line SGC7901 assessed by RT‐qPCR, n = 3, *P < .05 SGC7091 cell line vs GES‐1 cell line. C, The expression of CDK18 in gastric cancer cell line SGC7901 normalized to β‐actin measured by Western blot analysis, n = 3, *P < .05 oe‐MIR100HG vs oe‐NC. D, The expression of CDK18 in gastric cancer cell line SGC7901 normalized to β‐actin assessed by Western blot analysis, n = 3. E, The expression of CXXC4, MIR100HG and CDK18 measured by RT‐qPCR, n = 3. F, The proliferation of SGC7901 cells detected by CCK‐8 assay, n = 3. G, The proliferation ability and the proportion of activated IFN‐γ+ T cells of CD3+ detected by flow cytometry. H, The cytokine IFN‐γ secreted by T cells measured by ELISA, n = 3, *P < .05 oe‐CXXC4 + oe‐NC vs oe‐NC, # P < .05 oe‐CXXC4 + oe‐CDK18 vs oe‐CXXC4 + oe‐NC. Measurement data were expressed as mean ± SD. Comparisons between tumour and adjacent normal tissues in panel A were analysed using paired t test. The data conforming to normal distribution and homogeneous variance between two groups in panels B and C were analysed by unpaired t test. Comparisons among multiple groups in panels D, E, G and H were analysed using the one‐way ANOVA, followed by Tukey's post hoc test. The data at different time points in panel F were analysed by the repeated measures ANOVA followed by Bonferroni's post hoc test. The experiment was repeated three times independently
