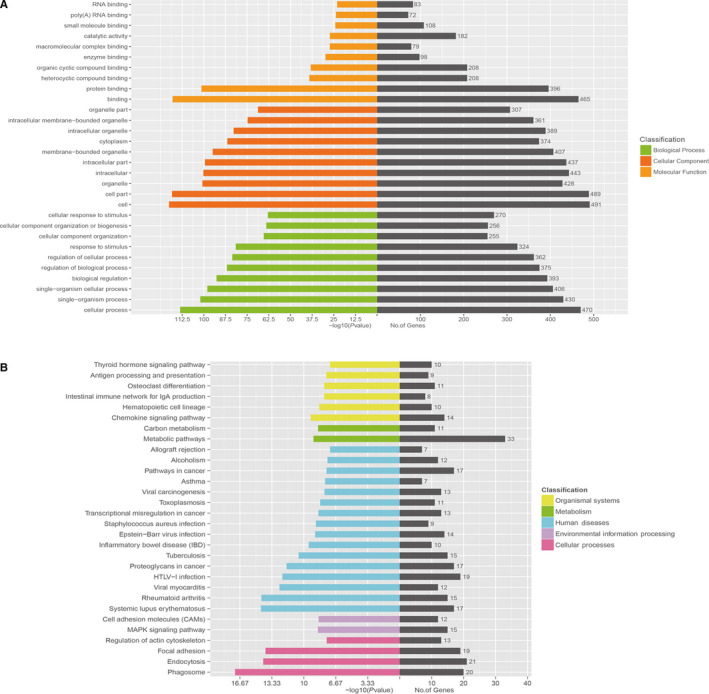
FIGURE 4.

GO analysis and KEGG pathway analysis. A, Top 10 GO terms with significantly differential expression from GO analysis of molecular function, biological process and cellular component are shown. B, Top 30 KEGG pathways with significantly differential expression are shown. Higher ‐LgP values indicate higher significance and lower –LgP values indicate lower significance
