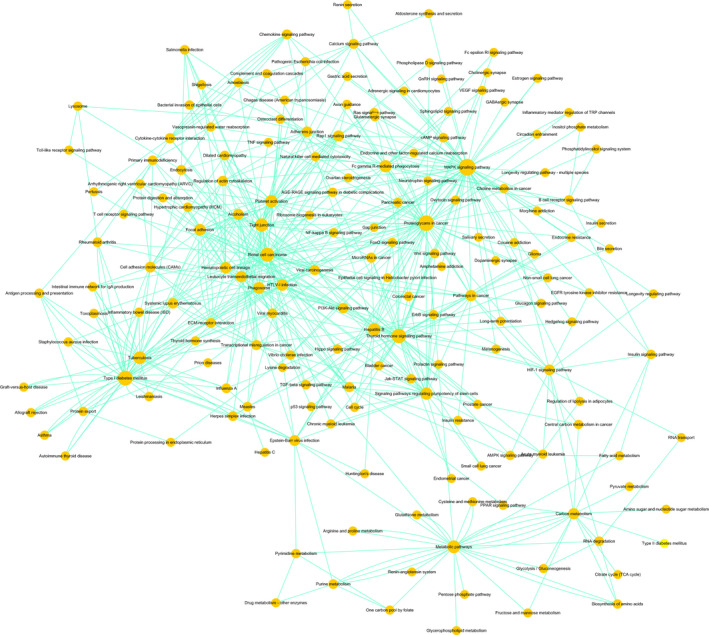
FIGURE 5.

Path‐net analysis. The interaction network for all significantly enriched pathways was done as a Path‐net. Nodes represent different pathways and the size of each circle is determined by the number of other genes that interact with this gene. Mitogen‐activated protein kinase (MAPK) signalling pathway plays a central role with the highest number of interactions with other pathways
