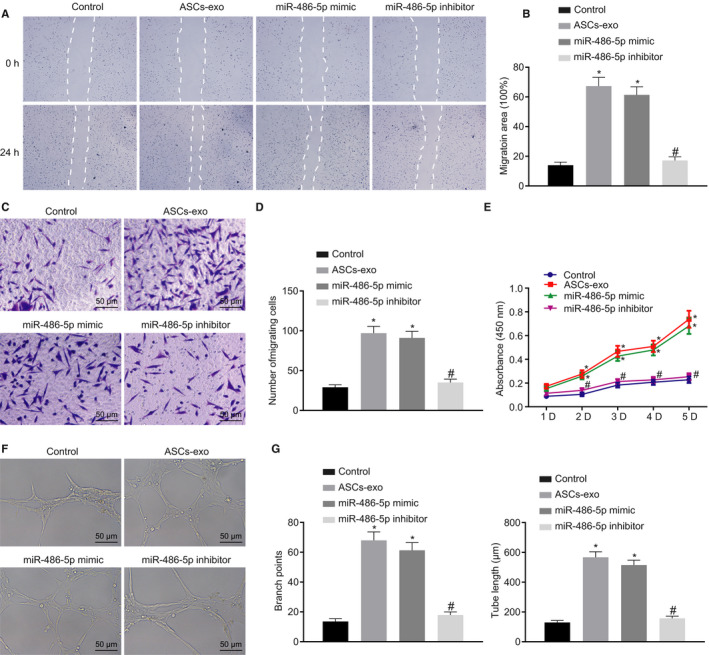
FIGURE 4.

miR‐486‐5p delivered in ASC‐EVs accelerates angiogenesis in HMECs. A and B, Migration of HMECs detected and quantified using the scratch test. C and D, Migration of HMECs examined and quantified using Transwell assay (×200). E, Cell proliferation monitored using CCK‐8 assay. F, Tube formation ability of HMECs assessed by Matrigel‐based assay (×200). G, Tube length and branch points in Figure F quantification. *P < 0.05 compared with the control group. # P < 0.05 compared with the treatment of ASC‐EVs. The measurement data were described as means ± standard deviation. Data between two groups were analysed by unpaired t test, whilst data amongst multiple groups were analysed by one‐way ANOVA followed by Tukey's test. Data at different time points were compared using repeated‐measures ANOVA with Bonferroni's test
