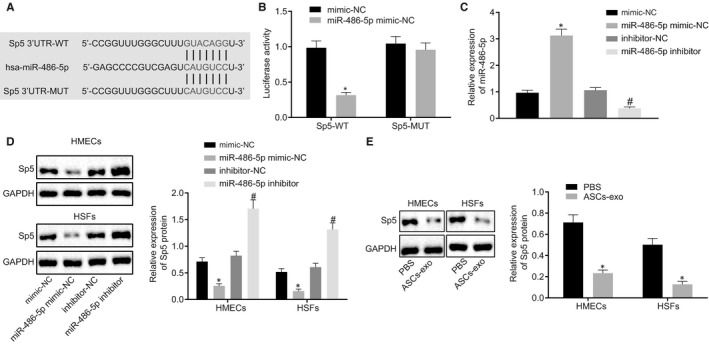
FIGURE 5.

The targeting relation between miR‐486‐5p and Sp5. A, The specific binding sites between miR‐486‐5p and Sp5 predicted by an online website (http://www.targetscan.org/vert_71/). B, The luciferase activity in different treatment analysed by dual‐luciferase reporter gene assay. C, miR‐486‐5p expression in HMECs and HSFs with different transfection determined using RT‐qPCR. D, Sp5 protein level in cells with different treatments measured using Western blot analysis. E, Sp5 protein level in cells with or without ASC‐EVs studied using Western blot analysis. *P < 0.05 compared with the treatment of mimic NC or PBS. # P < 0.05 compared with inhibitor NC treatment. The measurement data were described as means ± standard deviation. Data between the two groups were analysed by unpaired t test
