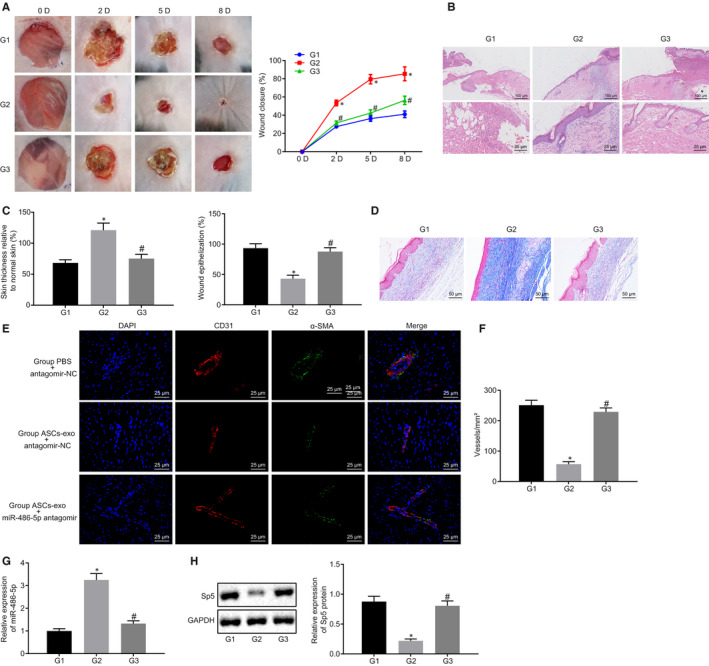
FIGURE 7.

Wound area angiogenesis is promoted by ASC‐EVs delivered miR‐486‐5p. A, Would closure rate calculated in the wound treated with ASC‐EVs and/or miR‐486‐5p antagomir at the 2nd, 5th and 8th day after the surgical procedure. B, HE staining on the wound after 8 d post‐treatment with ASC‐EVs and/or miR‐486‐5p antagomir (up: 100 µm; down: ×400). C, Scar thickness and epithelialization quantification. D, Masson's trichrome staining on wounds treated with ASC‐EVs and/or miR‐486‐5p antagomir (×200). E, Immunofluorescence staining on CD31 in the wound treated with ASC‐EVs and/or miR‐486‐5p antagomir (×400). F, The extent of angiogenesis quantification on F. G, The expression of miR‐486‐5p in the wound tissues measured using RT‐qPCR (wounds treated with PBS and antagomir NC as the group 1; with ASC‐EVs and antagomir NC as the group 2; with ASC‐EVs and miR‐486‐5p antagomir as the group 3). H, The expression of Sp5 in the wound tissues measured using RT‐qPCR and Western blot analysis (wounds treated with PBS and antagomir NC as the group 1; with ASC‐EVs and antagomir NC as the group 2; with ASC‐EVs and miR‐486‐5p antagomir as the group 3). *P < 0.05 compared with the treatment of ASC‐EVs and antagomir NC. The measurement data were described as means ± standard deviation. Data between two groups were analysed by unpaired t test, whilst data amongst multiple groups were analysed by one‐way ANOVA followed by Tukey's test. Data at different time points were compared using repeated‐measures ANOVA with Bonferroni's test (with 5 mice in each group)
