Figure 3.

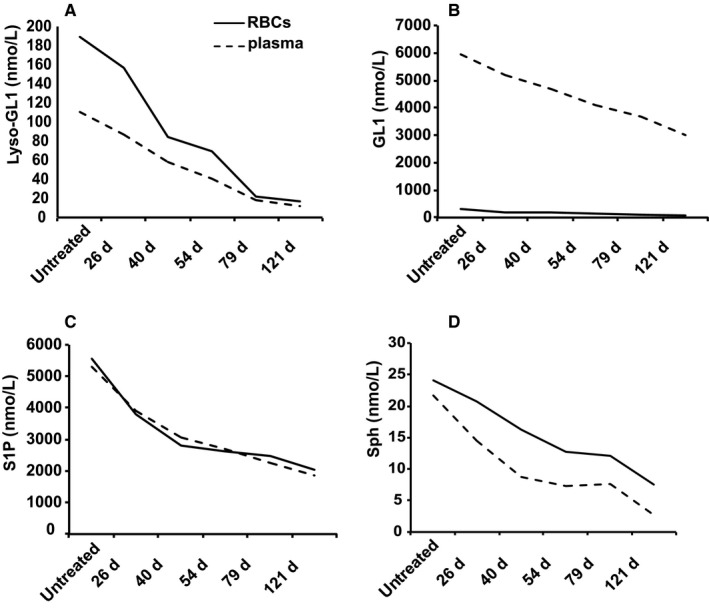
Follow‐up of a patient during the first 120 days of ERT. A decrease of the SL levels (GL1, Lyso‐GL1, Sph and S1P) in RBCs (full line) and plasma (dashed line) from a GD patient during the first 121 days of ERT

Follow‐up of a patient during the first 120 days of ERT. A decrease of the SL levels (GL1, Lyso‐GL1, Sph and S1P) in RBCs (full line) and plasma (dashed line) from a GD patient during the first 121 days of ERT