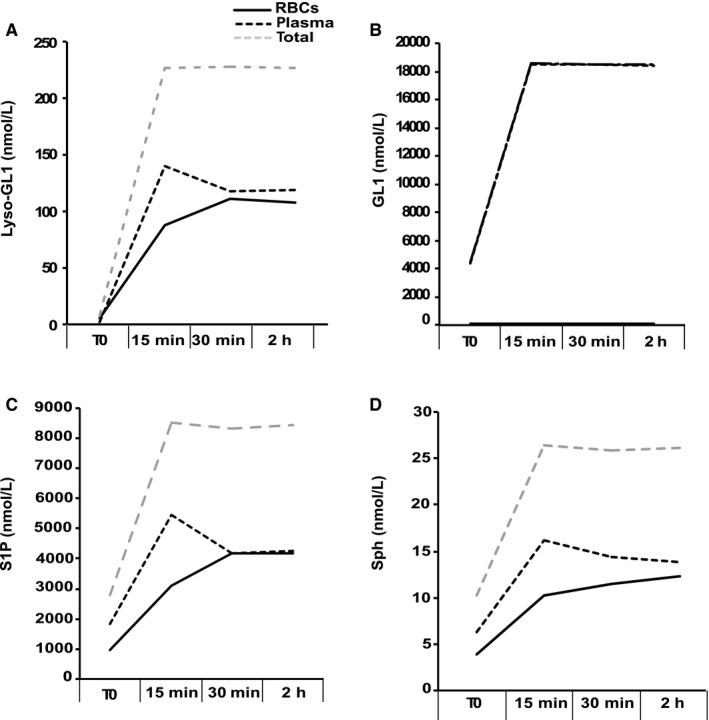
Figure 4.

Effect of exogenous sphingolipids added to control blood samples on SL content in RBCs. Graphs show representative results (n = 2) of the kinetic measurement of the four SLs (Lyso‐GL1, GL1, S1P and Sph in A, B, C and D, respectively) before (T0) and 15, 30 min, and 2 h after they were added on control blood samples in the RBC compartment (full lines), in the plasma compartment (dark dashed lines), and in both compartments (grey dashed lines)
