Figure 5.

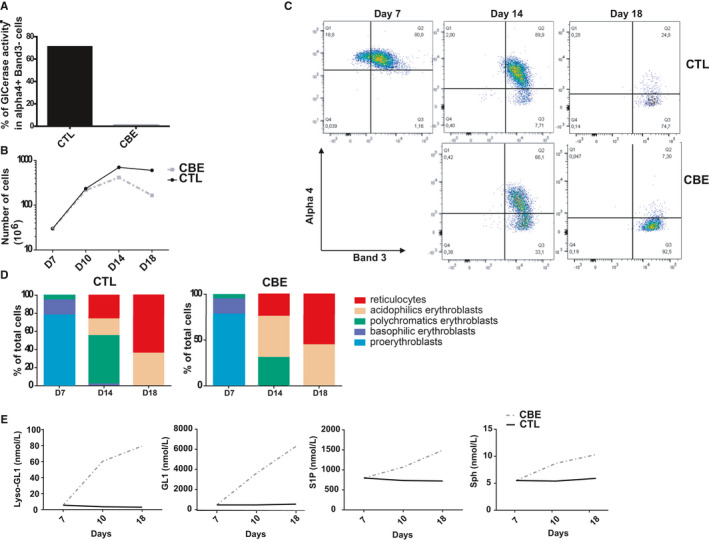
Effect of CBE during the in vitro erythropoiesis on the SL content. This Figure shows representative data (n = 2). A, The graph represents the percentage of cells with GCase activity in Alpha4+Band3− erythroid progenitor subsets in control (CTL) and CBE‐treated (CBE) cultures. B, Erythroid cell proliferation: the graph represents the number of cells in control culture (CTL, dark full line) and CBE culture (CBE, grey dashed line) from day 7 to day 18 of differentiation. C, Flow cytometry analysis of alpha4 and Band3 cell surface expression at day 7, 14 and 18 of differentiation. Alpha4+Band3− cells represent the early stage of differentiation and alpha4−Band3+ cells represent more mature stage of differentiation. D, Morphological analysis after May‐Grünwald‐Giemsa (MGG) staining. Graphs represent the percentage of each erythroid progenitor subset at days 7, 14 and 18 of differentiation for the control and CBE‐treated cultures. E, SL levels (GL1, Lyso‐GL1, Sph and S1P) measured over time in the control cell culture (CTL, dark full line) and in the CBE‐treated culture (CBE, grey dashed line). Lipids were measured using the UHPLC‐MS/MS method at days 7, 10 and 18 of differentiation
