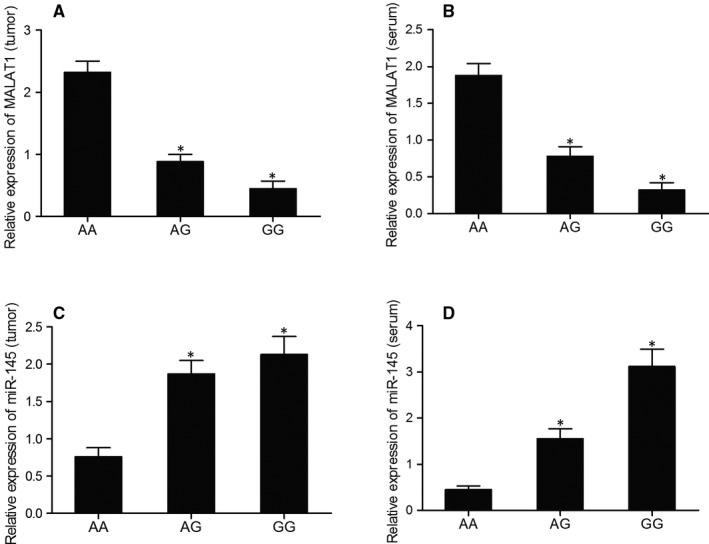
FIGURE 1.

Differentiated expression of MALAT1 and miR‐145 in tumour/serum samples of various genotypes suggested a possible negative relationship between MALAT1 and miR‐145 (*P value < .05. vs AA group). A, Relative mRNA expression of MALAT1 in tumour samples of various genotypes; B, Relative mRNA expression of MALAT1 in serum samples of various genotypes; C, Relative mRNA expression of miR‐145 in tumour samples of various genotypes; D, Relative mRNA expression of miR‐145 in serum samples of various genotypes
