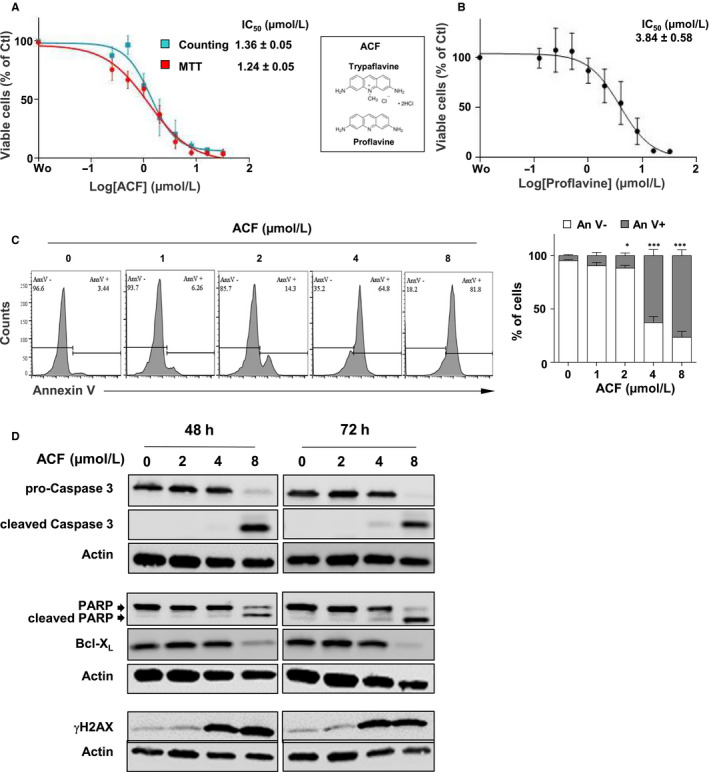
FIGURE 1.

Effect of acriflavine (ACF) on growth and survival of K562 cells. A, K562 cells were treated with various concentrations of ACF or not (PBS) for 72 h. Cell viability was determined by MTT and trypan blue dye exclusion assays (data are presented as mean ± SD of five independent experiments done in triplicates). IC50 values are indicated. B, Cells were treated with various concentrations of proflavine, and the percentages of viable cells were determined by MTT assays (data are presented as mean ± SD of three independent experiments done in triplicates). Chemical structures of proflavine and trypaflavine are shown. C, Cells cultured without (PBS) or with increasing concentrations of ACF for 72 h were stained with AnnexinV coupled with APC to determine the percentages of apoptotic cells by flow cytometry. One representative experiment is shown (left panel). Data are presented as mean ± SD of six independent experiments done in triplicates. Two‐way ANOVA followed by Holm‐Sidak's multiple comparison test was used to examine the significance of ACF treatment on apoptosis (*P < 0.05; ***P < 0.0001). D, Protein extracts from K562 cells cultured for 48 h or 72 h with increasing concentrations of ACF were analysed by western blot with the indicated antibodies (n = 3). Actin served as the loading control
