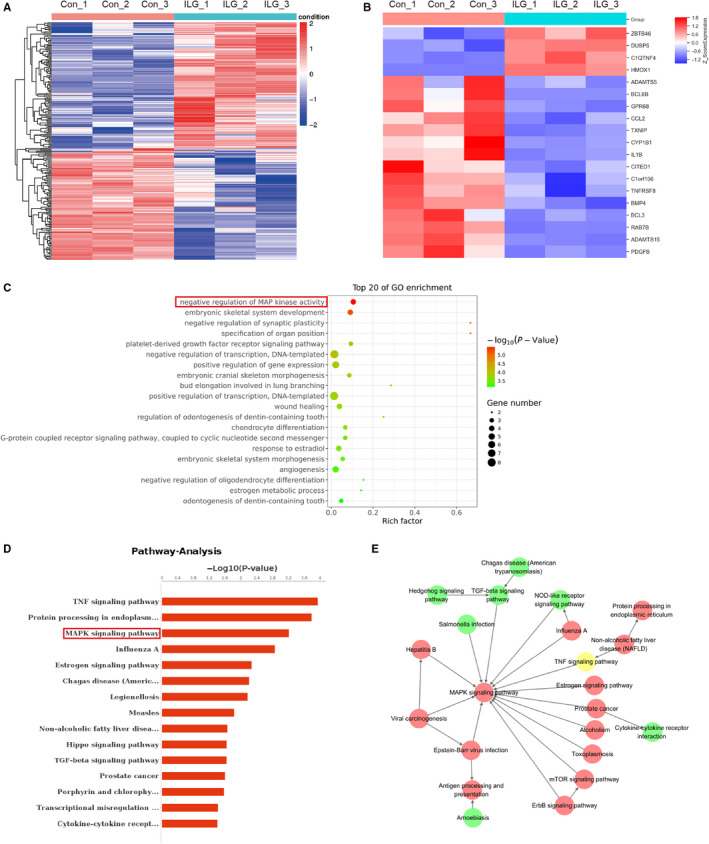
FIGURE 4.

RNA‐seq analysis in hPSCs with or without ILG treatment. Hierarchical cluster analysis of DEGs was performed to explore transcripts expression pattern. According to the screening criteria (P value < .05 and fold Change > 2 or fold Change < 0.5), a total of 238 differentially expressed genes (DEGs) were identified between ILG treatment group and control group. The hierarchical clustering heat map of all DEGs (A) and part of the pancreatic fibrogenic and pro‐inflammatory–related DEGs (B) were depicted. The top 20 GO term (C) and pathway analysis (D) analysis of DEGs was performed using R based on the hypergeometric distribution. (E) The pathway interaction net of the DEGs was analysed and depicted, in which the up‐ (red circle) and down‐regulated (green circle) pathways were indicated
