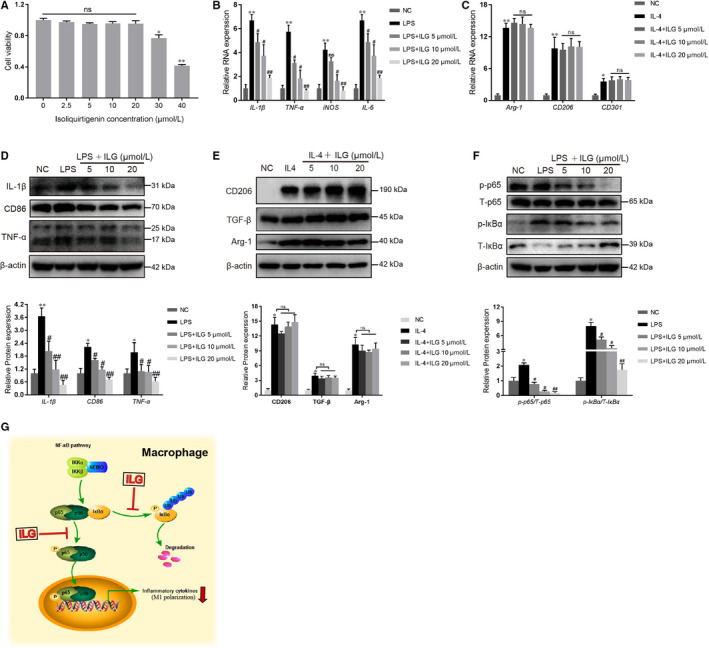
FIGURE 6.

ILG restrains the M1 polarization of macrophages through NF‐κB pathway. (A) RAW 264.7 cells were treated with different doses of ILG for 24 h, and then, the cell viability was measured by CCK‐8. (b and e) The effects of ILG on macrophages polarization were evaluated. The mRNA and protein expression level of M1‐type markers (B and D, 500 ng/mL LPS pre‐induction for 1 h) and M2‐type markers (C and E, 20 ng/ml IL‐4 pre‐induction for 24 h) were determined by qRT‐PCR and WB, respectively. (F) RAW 264.7 cells were pre‐treated with ILG for 1 h and subsequently stimulated with LPS for 6 h. The effects of ILG on the NF‐κB signalling pathway (p‐p65 and p65, p‐IκBα and IκBα) were detected by WB assays. The band signals were assessed using GeneTools software and statistically presented in the histogram below. All data were presented as mean ± SD of at least three independent experiments. *P < .05, **P < .01 compared with the NC group; #P < .05, ##P < .01 compared with the LPS group; ns: P > .05. (G) A schematic diagram illustrating the underlying mechanism by which ILG inhibits the NF‐κB signalling and the M1 polarization of macrophages
