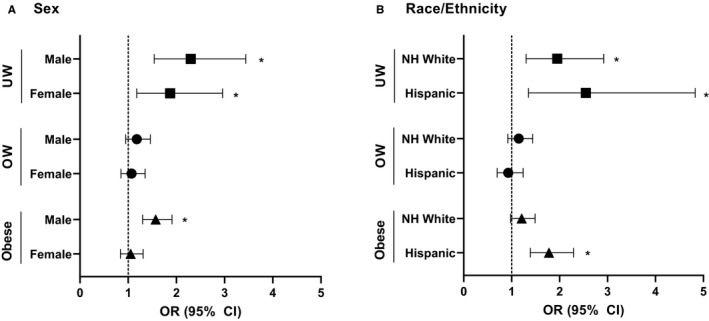
FIGURE 3.

A, Odds of B‐ALL by BMI category by sex. Calculated by multivariable conditional logistic regression. Model adjusted for: SES (High, Low), sampling year and age at sampling/diagnosis. Normal weight used as reference. Asterisks (*) indicates significant findings. Abbreviations: ALL, Acute Lymphoblastic Leukemia; OW, Overweight; UW, Underweight. B, Odds of B‐ALL by BMI category by race/ethnicity. Calculated by multivariable conditional logistic regression. Model adjusted for: SES (High, Low), sampling year and age at sampling/diagnosis. Normal weight used as reference. Asterisks (*) indicates significant findings. Abbreviations: ALL, Acute Lymphoblastic Leukemia; NH, Non‐Hispanic; OW, Overweight; UW, Underweight
