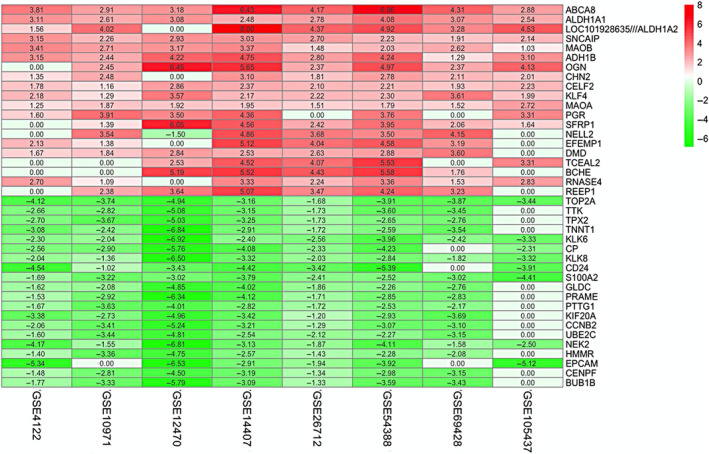
FIGURE 1.

Identification of robust DEGs by RRA method. Heatmap shows the top 20 up‐regulated and down‐regulated DEGs in GEO series accessions. Each row denotes one DEG, and each column represents one data set. The colour changes from red to green indicates regulation from up to down. The numbers in the box stand for logarithmic fold change
