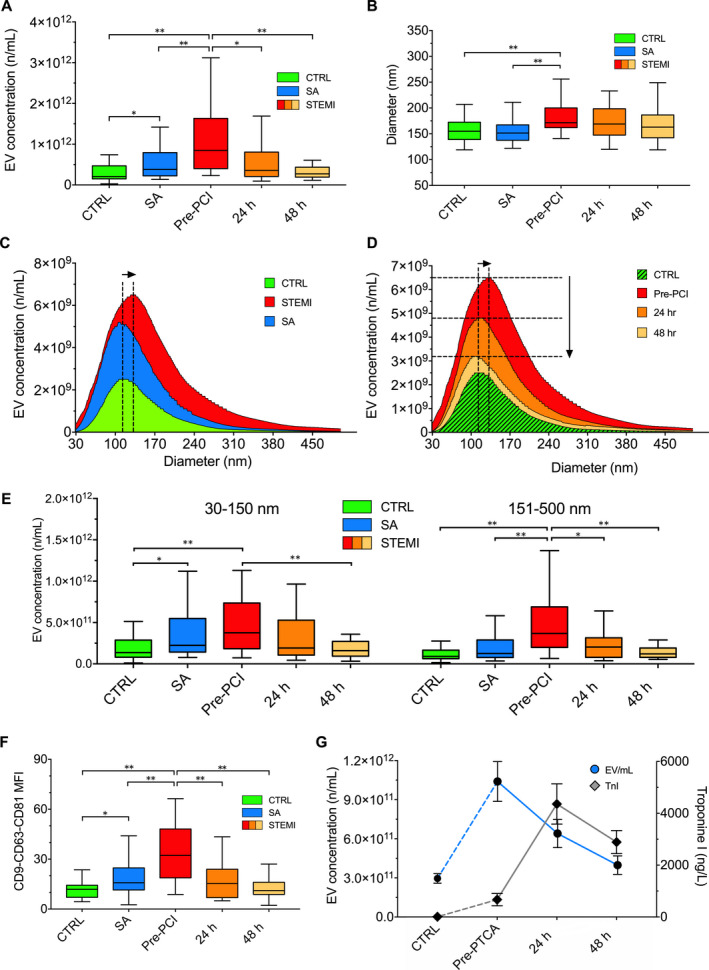
FIGURE 1.

Nanoparticle tracking analysis. Nanoparticle Tracking Analysis of circulating EVs in the three groups of patients of the training cohort (controls, CTRL vs stable angina, SA vs. STEMI pre‐PCI and 24/48 h thereafter). (A) EV (extracellular vesicles) concentration; (B) EV diameter; (C and D) Cumulative distribution plot combining EV concentration (n/mL; y‐axes) and diameter (nm; x‐axes); (E) EV number stratified for EV diameter (30‐150 nm vs 151‐500 nm). (F) Mean fluorescence intensity (MFI) for CD9, CD63 and CD81 markers measured by flow cytometry. (G) EV concentrations and hs‐troponin in Ctrl and STEMI patients at different time points. Data and statistical analysis: see Tables S7 and S8. Data are shown as median and interquartile range. *P < .05; **P < .01
