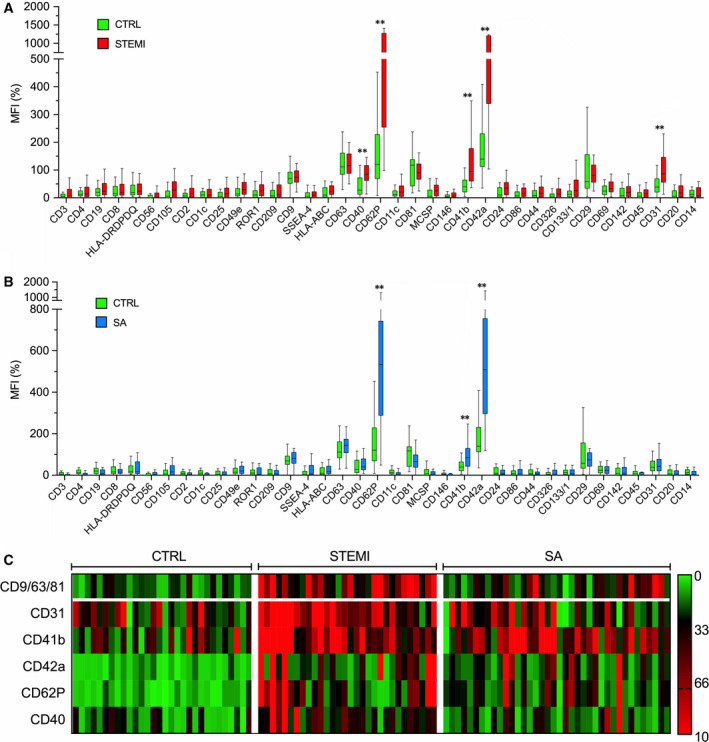
FIGURE 2.

Flow cytometric analysis of EV surface epitopes. Multiplex flow cytometry analysis. Median fluorescence intensities (MFI; [%]) for all EV epitopes, referenced to mean MFI of EV‐specific markers (CD9, CD63 and CD81) in the training cohort. A, STEMI vs Ctrl. B, SA vs Ctrl. C, Heat map showing MFI for EV epitopes expressed at significantly higher levels in STEMI patients vs SA vs controls. Data and statistical analysis: see Table S9. Data are shown as median and interquartile range. *P < .05; **P < .01
