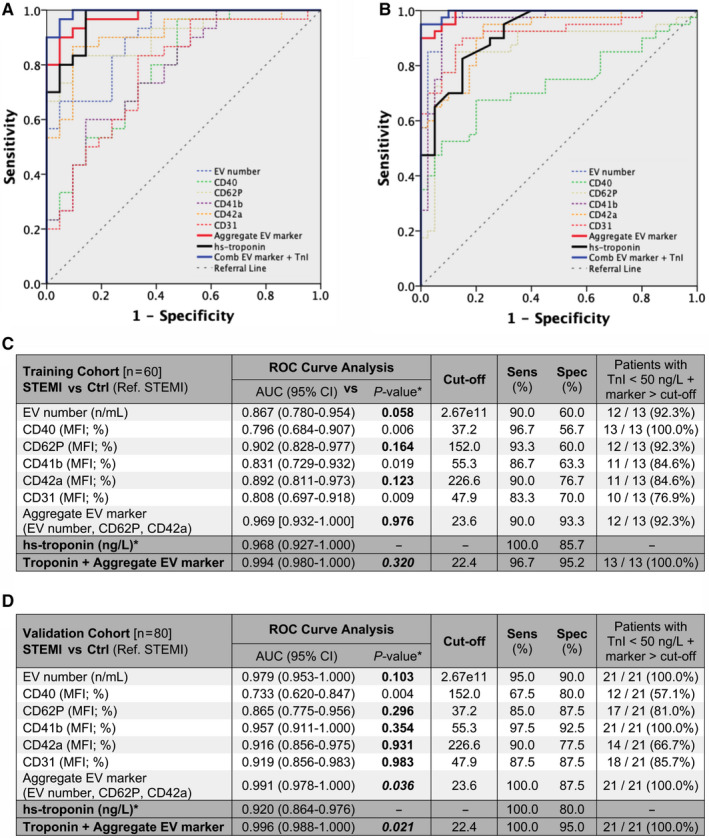
FIGURE 4.

Diagnostic performance of EV markers. Diagnostic performance of EV concentration (by NTA) and five EV markers, compared with hs‐troponin (*P‐values refer to the comparisons of the areas under the curves, AUCs) in the training cohort and in the validation cohort (n = 60 and n = 80, respectively; STEMI patients pre‐PCI vs. Ctrl). A and B, ROC curve analysis for hs‐troponin (black curve) compared to individual EV markers (dashed curves), an aggregate EV marker including EV concentration, CD62P MFI, and CD42a MFI; red curve), and to the combination of the aggregate EV marker with hs‐troponin (blue curve). C and D, AUC (95% Confidence Interval; CI), best cut‐off (according to Youden's index analysis), sensitivity (%) and specificity (%), and percentages of patients with minimally increased hs‐troponin (troponin <50 ng/L) showing levels of EV markers higher than the respective cut‐off. Bold characters indicate P‐values of diagnostic performances showing non‐inferiority to hs‐troponin (AUC for EV markers < AUC for hs‐troponin; P ≥ .05) or superiority to hs‐troponin (AUC for EV markers > AUC for hs‐troponin; P < .05)
