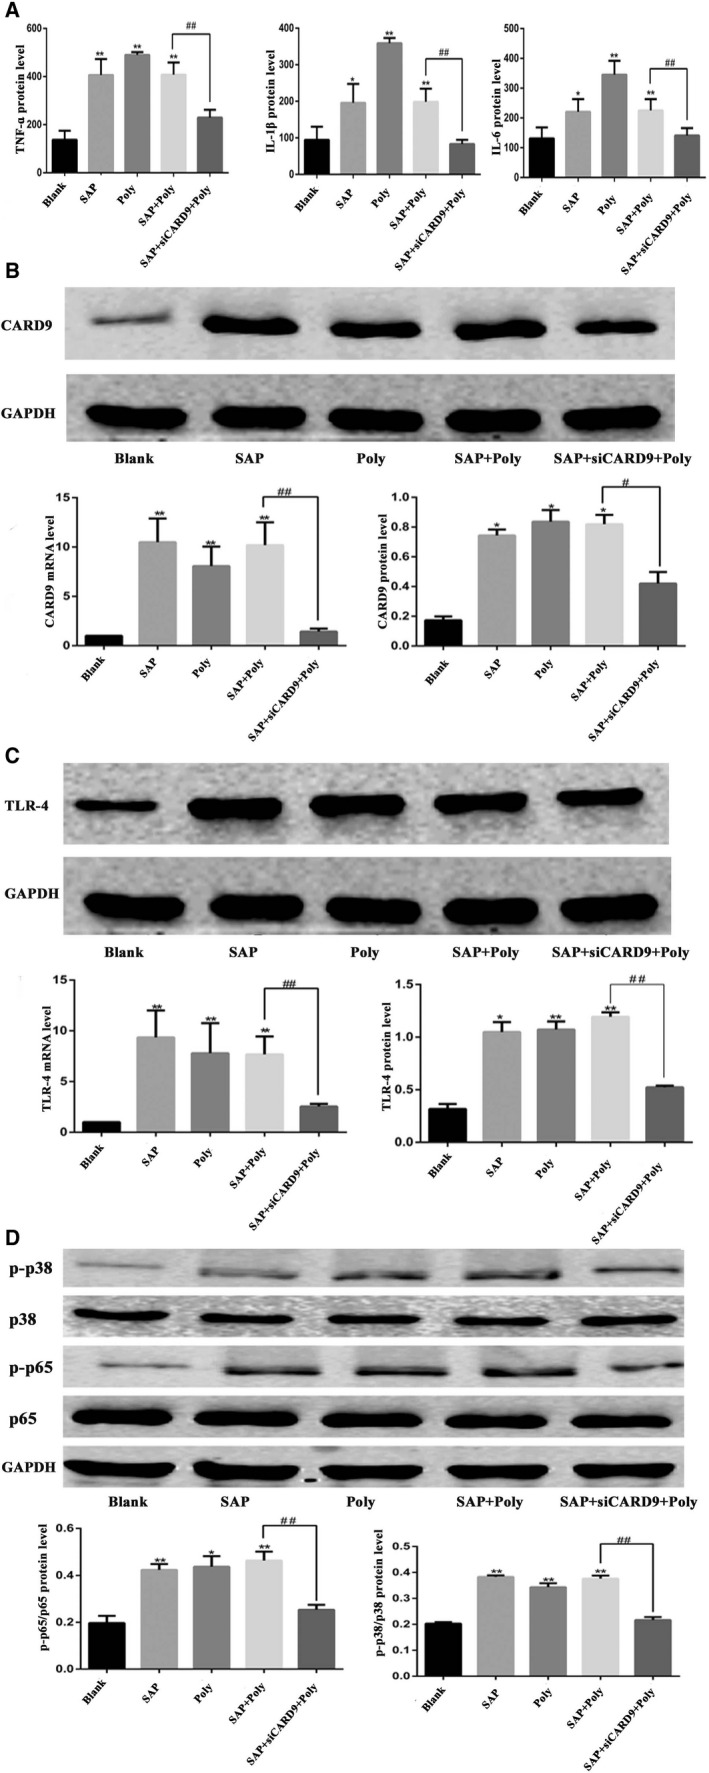
Figure 7.

Activation of the TLR4 pathway by polyinosine and suppression of Card9 expression by the si‐Card9 adenovirus. A, The level of TNF‐α, IL‐1βand IL‐6 in cell culture medium from each group. B, mRNA and protein expression of CARD9 in each group. The molecular weight of the CARD9 bands was 62 kD. C, mRNA and protein expression of TLR4 in each group. The molecular weight of the TLR4 bands was 95 kD. D, Phosphorylation of NF‐κB and P38 in peritoneal macrophages from each group at the 6‐h time point. The molecular weight of the NF‐κBp65 and P38 bands were 65kD and 43 kD.*: SAP group or Poly or SAP + Poly group vs Blank group, P < .05; **: SAP group or Poly or SAP + Poly group vs Blank group, P < .01; #: SAP + siCARD9+ Poly group vs SAP + Poly group, P < .05; ##: SAP + siCARD9+ Poly group vs SAP + Poly group, P < .01
