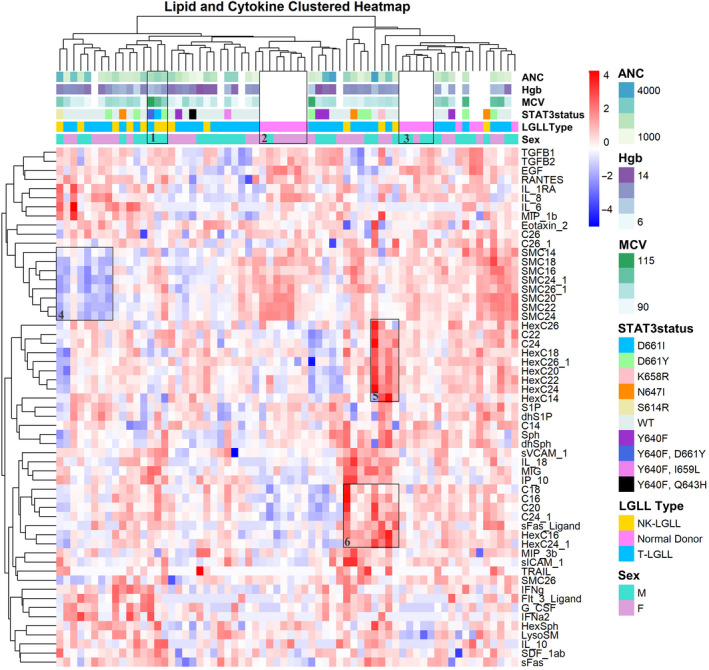
FIGURE 2.

Heatmap of large granular lymphocyte (LGL) leukemia and normal donor serum samples with cytokine and sphingolipid values. A heatmap was generated for LGL leukemia samples and normal donors and grouped using hierarchical clustering. Serum cytokine and sphingolipid values were log 10 transformed and scaled prior to this analysis. Red and blue indicate high and low levels, respectively, of cytokine or sphingolipid relative to the mean value in each row. Additional information such as clinical data, STAT3 mutation status, LGL leukemia type, and sex are indicated on the top of the heatmap and were not a part of the clustering algorithm. These parameters are defined in the legend on the right and explored in more detail in later figures and tables. The clinical data for the patients matched exactly with the serum sample date, except for one case where it was different by 6 weeks. Five patients do not have clinical data listed since their blood count data were too far off from the serum sample date. These samples are shown as white. The normal donor samples do not have clinical or STAT3 data, therefore, these areas are also white. Hierarchal clustering analysis based on Euclidean distance demonstrates clustering and is annotated by numbered boxes (discussed in Section 3)
