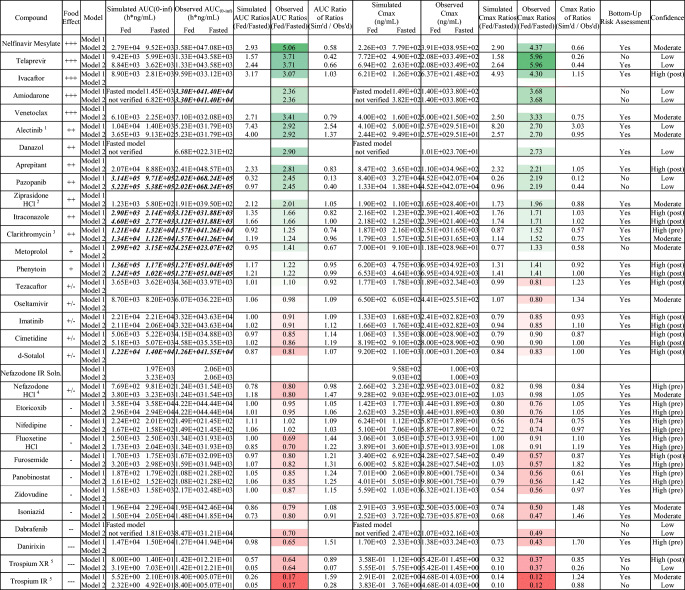
Table II.
Summary of the Outcome of Food Effect PBPK Modeling for 30 Compounds and the Associated Confidence in the PBPK Food Effect (FE) Prediction and Risk Assessment. The Color Coding Represents the Food Effect Direction with Green and Red Signifying Positive and Negative Food Effect, Respectively
Bold italicized text indicates AUC(0-t), not AUC(0-inf)
1The model-specific discrepancy in confidence for alectinib is not currently well understood
2Although ziprasidone qualifies as high confidence given AUC and Cmax ratios of ratios which fall within bioequivalence criteria, the simulated, fed-state plasma concentration-time profile poorly captured observed data. As such, ziprasidone was qualified as moderate confidence
3Although clarithromycin model 2 demonstrated superior food effect prediction accuracy, model 2 required optimization to capture fasted clinical data. As model 1 utilized a purely bottom-up approach, confidence in that model is higher
4Simulation of clinical nefazodone concentration-time data initially resulted in overprediction, possibly explained by partial gastric emptying in vivo. Model 1 but not model 2 incorporated partial gastric emptying, explaining the final model-specific discrepancy in confidence
5The use of different methods to optimize individual segmental Peffs between models 1 and 2 may explain the model-specific discrepancy in confidence for trospium IR and XR formulations

