
FIGURE 2.
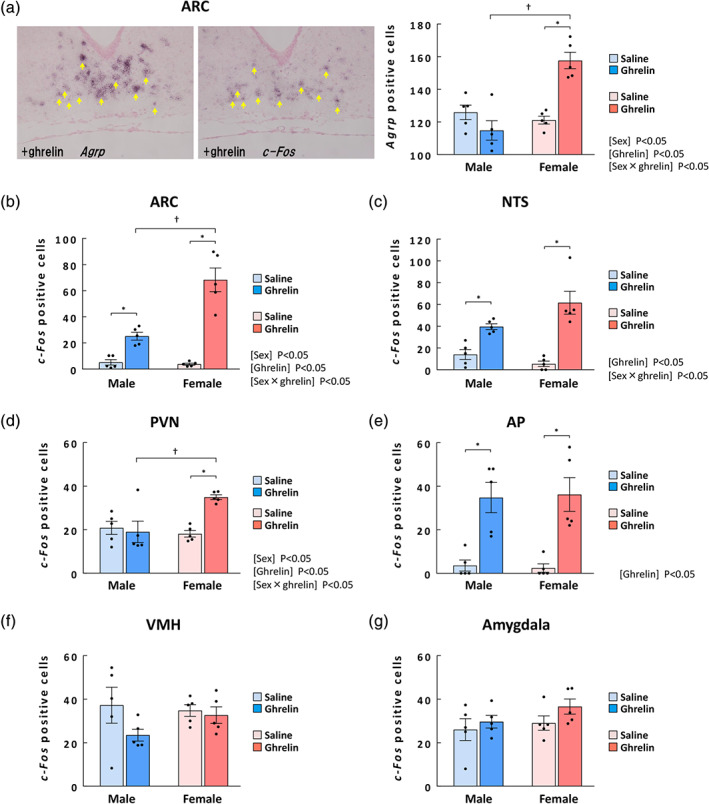
Effects of acylated ghrelin administration on ghrelin signalling in male and female naïve mice. (a) Representative images of Agrp‐positive cells (left panel) and c‐Fos‐positive cells (middle panel) indicated by yellow arrows in the ARC at 0.5 h after administration of 50 nmol·kg−1 ghrelin. Right graph: the number of Agrp‐positive cells in the ARC of males and females; (b) number of c‐Fos‐positive cells in the ARC of males and females; (c) number of c‐Fos‐positive cells in the NTS of males and females; (d) number of c‐Fos‐positive cells in the PVN of males and females; (e) number of c‐Fos‐positive cells in the AP of males and females; (f) number of c‐Fos‐positive cells in the VMH of males and females; and (g) number of c‐Fos‐positive cells in the amygdala of males and females. n = 5 per group. Results are shown as means ± SEM. *P < 0.05 vs. each saline, † P < 0.05 in two‐way ANOVA followed by the Tukey–Kramer post hoc test