
FIGURE 3.
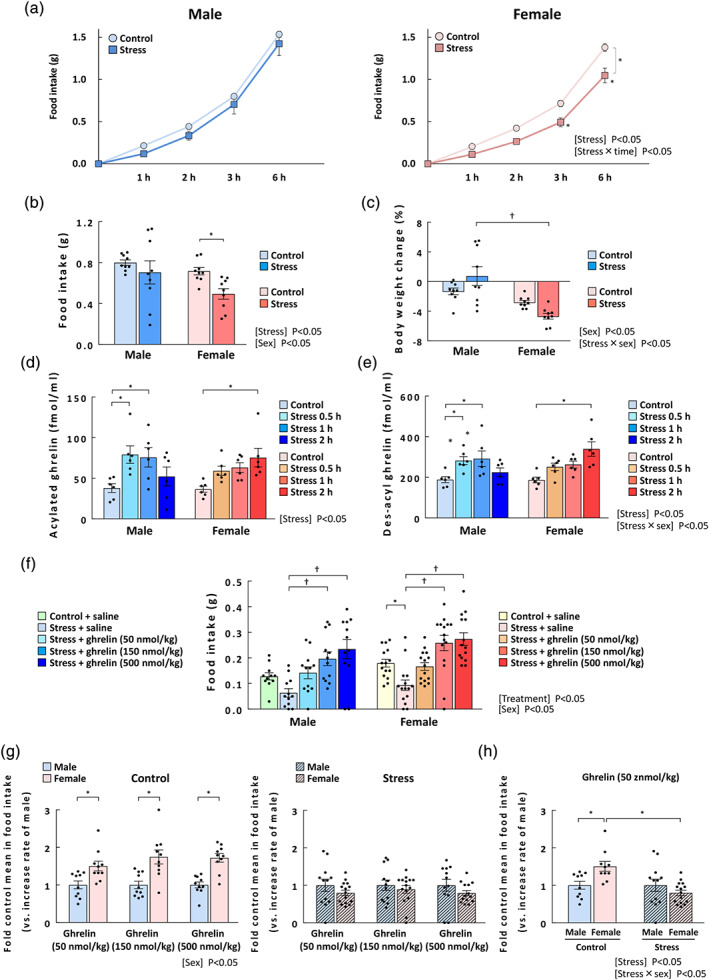
Changes in cumulative food intake, body weight, and plasma ghrelin and the effect of ghrelin on food intake in male and female stressed mice. (a) Sequential change in food intake, *P < 0.05 in two‐way repeated measures ANOVA followed by the Bonferroni post hoc test; (b) food intake at 3 h; and (c) body weight changes (%). The cumulative food intake was measured at 1, 2, 3, and 6 h after exposure to novelty stress. The body weight was measured before and at 24 h after stress exposure. n = 9 per group. (d) Plasma acylated ghrelin levels; (e) plasma des‐acyl ghrelin levels. The blood samples were collected 0.5, 1, and 2 h after exposure to novelty stress. n = 6 per group. (f) Effects of ghrelin treatments on stressed mice. The mice were i.p. administered acylated ghrelin at 50, 150, or 500 nmol·kg−1 immediately after stress exposure, and the 0.5‐h cumulative food intake was measured after ghrelin administration. Two mice were excluded due to an obvious researcher's technical mistake. Male control + saline: n = 11 (excluded: 1); male‐other groups: n = 12; female stress + ghrelin 500 nmol·kg−1: n = 14 (excluded: 1); female‐other groups: n = 15. (g) The relative increase in food intake after ghrelin administration in control mice (left) and stressed mice (right); (h) the relative increase in food intake after ghrelin administration at a dose of 50 nmol·kg−1 in male and female mice. Results are shown as means ± SEM. *P < 0.05 vs. each control or male, † P < 0.05 in two‐way ANOVA followed by the Dunnett, Bonferroni, or Tukey–Kramer post hoc test