
FIGURE 7.
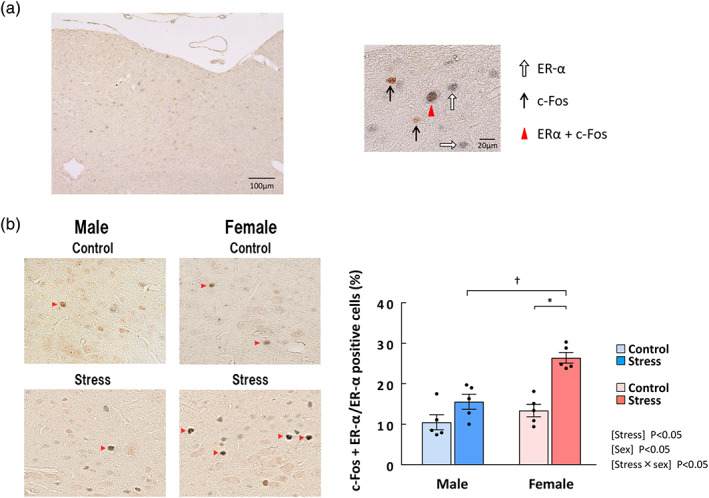
The percentage of estrogen receptor (ER)‐α/c‐Fos‐double‐positive cells among ERα‐positive cells in the NTS after stress exposure in male and female mice. (a) Left: the area containing NTS after double staining for ERα and c‐Fos. Right: Typical cells showing immunoreactivity for ERα (white arrow), c‐Fos (black arrow), and both proteins (red triangle). (b) Representative ERα/c‐Fos‐double‐positive cells in the NTS (left) and the percentage of ERα/c‐Fos‐double‐positive cells among ERα‐positive cells in the NTS of male and female mice (right). The red arrowhead indicates ERα/c‐Fos‐double‐positive cells. Mouse brains were collected 0.5 h after the onset of stress exposure. n = 5 per group. Results are shown as means ± SEM. *P < 0.05 in two‐way ANOVA followed by the Tukey–Kramer post hoc test