
FIGURE 5.
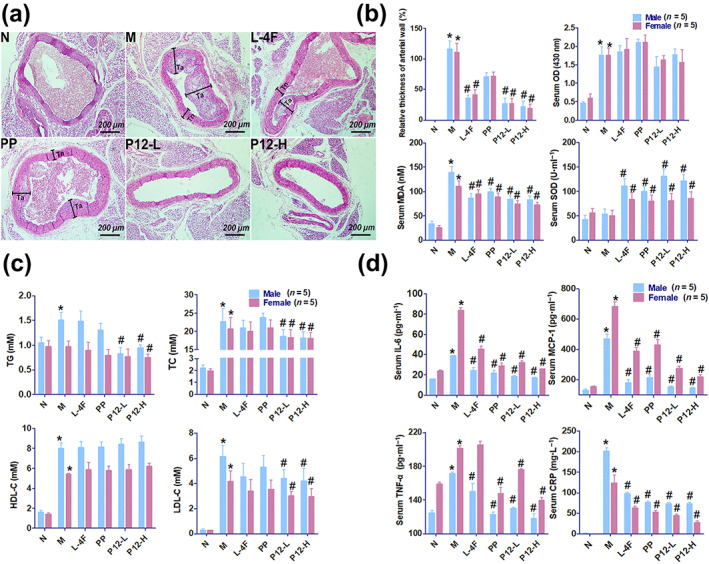
The arterial plaque‐reducing effect of P12 in apoE−/− mice and relative thickness of arterial wall (%), serum malondialdehyde (MDA), SOD, lipid (triacylglycerol [TG], total cholesterol [TC], HDL‐C, and LDL‐C), and inflammatory factor levels (IL‐6, CCL2, TNF‐α, and C‐reactive protein [CRP]), and serum turbidity (OD, OD430 nm) in mice. (a) The effects of P12 on atherosclerosis in apoE−/− mice (cross section of arteries, staining with haematoxylin and eosin, normal thickness of the arterial wall is indicated by black lines and Tn, and abnormal thickness of arterial wall is indicated by black lines and Ta). (b) Effects of P12 on the relative thickness of arterial wall and serum turbidity, MDA, and SOD levels. Relative thickness of the arterial wall (%) = (Ta − Tn)/Tn × 100%. Five mice were taken from each group, and three samples were taken from each mouse. Serum turbidity was presented as OD430 nm. The relative thickness of arterial wall, serum turbidity, and serum MDA levels were decreased by P12 treatment, whereas serum SOD level was increased. (c) Effects of P12 on serum lipid levels (TG, TC, HDL‐C, and LDL‐C). Serum TG, TC, and LDL‐C levels were decreased by P12. (d) Effects of P12 on serum inflammatory factor levels (IL‐6, CCL2, TNF‐α, and CRP). Serum IL‐6, CCL2, TNF‐α, and CRP levels were decreased by P12 treatment in apoE−/− mice. Each data point represents the mean ± SEM. * P < 0.05, significantly different from normal control. # P < 0.05, significantly different from model control; oOne‐way ANOVA followed by Dunnett's post hoc test. n = 10, including five male and five female mice. P12‐L and P12‐H indicate treatment with 10 and 20 mg·kg−1 P12 respectively. L‐4F, L‐4F (10 mg·kg−1) treatment group; M, model control group; N, normal control group; PP, parent peptide apoA‐I221–240 (10 mg·kg−1) treatment group