
FIGURE 8.
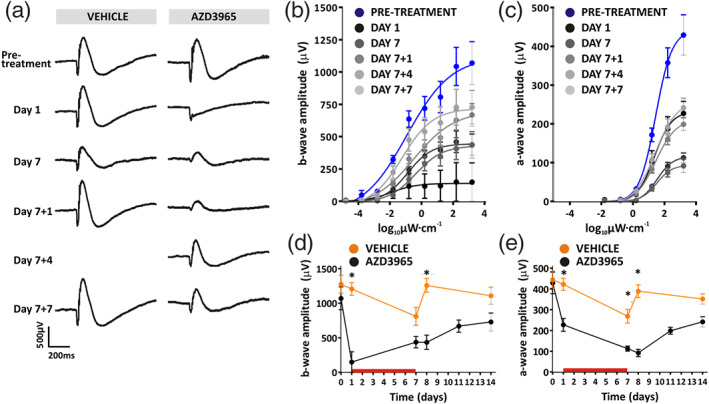
Long‐term effects of 1,000 mg·kg−1 p.o. AZD3965 on dark‐adapted ERG. (a) Representative ERG traces at 3.1 log10 μW·cm−2 at time points before, during, and after dosing with vehicle (left panel) or 1,000 mg·kg−1 AZD3965 (right panel). These long‐term effects are demonstrated in (b) and (c), which display b‐ and a‐wave amplitudes, respectively, to increasing light intensity flashes (−4.9 to 3.1 log10 μW·cm−2) at time points before, during, and after dosing with 1,000 mg·kg−1 AZD3965. Time‐dependent differences are quantified in (d) and (e), which show b‐wave and a‐wave amplitudes, respectively, for vehicle (orange) and 1,000 mg·kg−1 AZD3965 (black) treated animals. The red horizontal bar in (d) and (e) indicates the period of dosing. Data were compared with a two‐way ANOVA, and differences between vehicle and AZD3965‐treated animals were compared at individual time points using Bonferroni post hoc test. For b‐wave: day 0, P > 0.05; day 1, P < 0.05; day 7, P > 0.05; day 7 + 1, P < 0.05; day 7 + 7, P > 0.05. For a‐wave: day 0, P > 0.05; day 1, P < 0.05; day 7, P < 0.05; day 7 + 1, P < 0.05; day 7 + 7, P > 0.05. Data presented are mean ± SEM. n = 6 for all groups. * P < 0.05 compared to vehicle control group