
FIGURE 9.
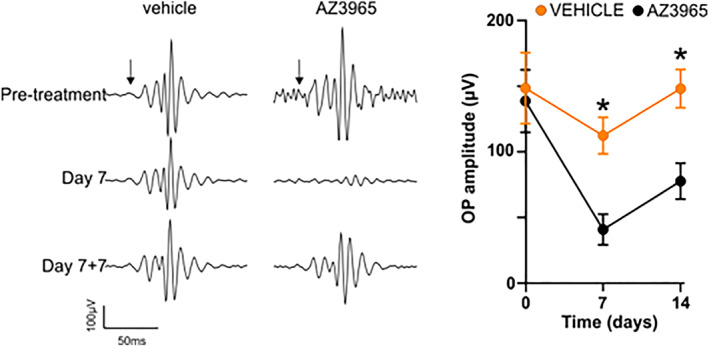
Long‐term effects of 1,000 mg·kg−1 p.o. AZD3965 on oscillatory potentials of dark‐adapted ERG. Left panel: representative recordings of oscillatory potentials prior to the start of the dosing phase, on Day 7 of dosing, and at 7 days after cessation of dosing with either vehicle or AZD3965 (1,000 mg·kg−1 per day). Right panel: Group mean data for oscillatory potential amplitude for 1,000 mg·kg−1 AZD3965 (grey data points) or vehicle (orange). Data were compared with a two‐way ANOVA and differences between vehicle and AZD3965‐treated animals were compared at individual time points using Bonferroni post hoc test. Day 0, P > 0.05; Day 7: P < 0.05; Day 14: P < 0.05. Data presented are mean ± SEM. n = 6 for all groups. * P < 0.05 compared to vehicle control group