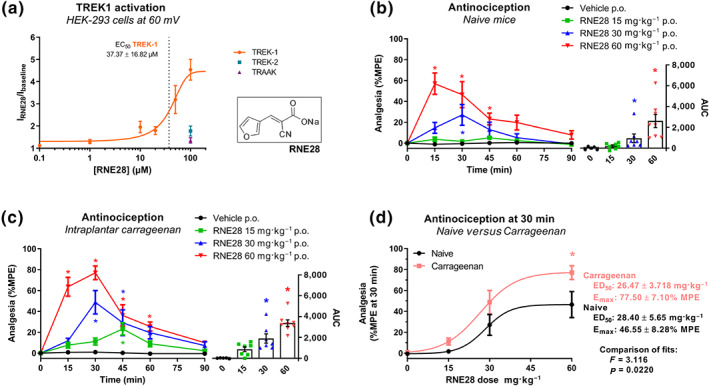
FIGURE 1.

Activation of TREK1 by RNE28 and its antinociceptive activity in mice. (a) Currents recorded at +60 mV in HEK‐293 cells transfected with the human TREK1 channel in response to 0.1 (n = 6), 1 (n = 6), 10 (n = 5), 20 (n = 6), 50 (n = 7), 100 (n = 7) and 200 (n = 5) μM of RNE28, expressed as the ratio of currents recorded after and before RNE28 exposure. TREK1 dose–effect curve was generated by the least square method. Responses to 100‐μM RNE28 of cells transfected with the human TREK2 (n = 10) and TRAAK (n = 5) channels are indicated. The insert shows RNE28 skeletal formula. (b) Left, time course of the antinociceptive effect induced by 0 (n = 5), 15 (n = 8), 30 (n = 7) and 60 (n = 8) mg·kg−1 RNE28 administered orally in naive mice. Pain thresholds were assessed by paw immersion in 46°C water and plotted as %MPE. Right, AUCs calculated from 0 to 90 min post‐administration. (c) Left, time course of the antinociceptive effect induced by 0 (n = 5), 15 (n = 7), 30 (n = 7) and 60 (n = 8) mg·kg−1 RNE28 administered orally in mice 3.5 h following paw inflammation induction by intraplantar carrageenan injection (20 μl, 3%). Pain thresholds were assessed by paw immersion in 46°C water and plotted as %MPE. Right, AUCs calculated from 0 to 90 min post‐administration. (d) Dose–effect curves of the antinociceptive activity of RNE28 30 min following oral gavage in naive (a) and carrageenan‐injected (b) mice. Datasets were fitted with the least square method and fits were compared with the extra sum‐of‐square F test. ED50, Emax, and P and F values are shown on the right. * P < 0.05 versus vehicle (b, c) or naive (d). Two‐way ANOVA followed by Dunnett's post hoc test (b, c left), Kruskal–Wallis followed by Dunn's post hoc test (b, c right) and two‐way ANOVA followed by Sidak's post hoc test (d). n numbers represent cells (a) or mice (b–d)
