FIGURE 5.

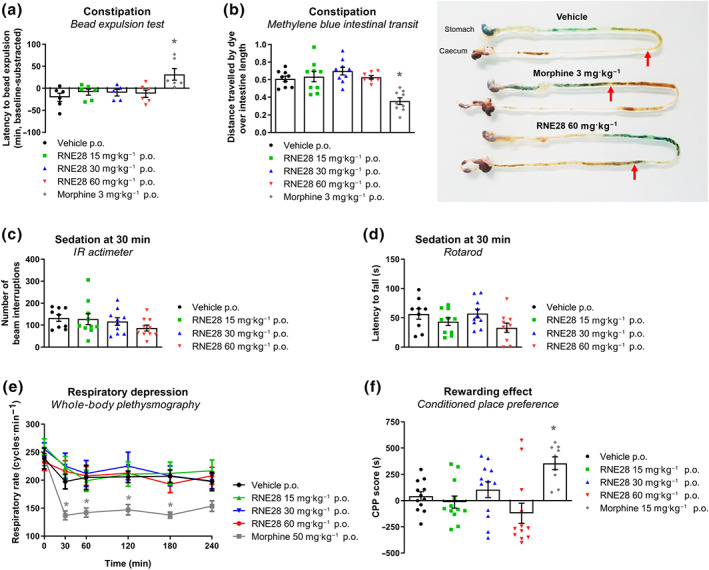
Opioid‐related adverse effects monitoring in RNE28‐treated mice. (a) Latency to expulsion of a 3‐mm‐diameter bead inserted intrarectally in mice 30 min after oral gavage with 3 mg·kg−1 morphine (n = 6 mice) or 0 (n = 6), 15 (n = 6), 30 (n = 5) or 60 (n = 6) mg·kg−1 RNE28. Results are shown in minutes as differences between post‐gavage and baseline latencies (baseline‐subtracted). (b) Left, intestinal progression of methylene blue administered by oral gavage in mice 30 min after oral gavage with 3 mg·kg−1 morphine (n = 9 mice) or 0 (n = 9), 15 (n = 9), 30 (n = 9) or 60 (n = 8) mg·kg−1 RNE28. Mice were killed 15 min after methylene blue gavage. Results are expressed as percentage of the stomach to caecum distance covered by methylene blue. Right, representative intestines of mice treated with the vehicle, 3 mg·kg−1 morphine or 60 mg·kg−1 RNE28. Red arrows indicate the distance travelled by the dye. (c) Locomotor activity of mice, monitored by IR actimetry 30 min after oral gavage with 0 (n = 9), 15 (n = 10), 30 (n = 10), or 60 (n = 10) mg·kg−1 RNE28. (d) Motor coordination of mice, assessed by the rotarod test 30 min after oral gavage with 0 (n = 9), 15 (n = 10), 30 (n = 10) or 60 (n = 10) mg·kg−1 RNE28. (e) Respiratory rate of conscious mice monitored by whole‐body plethysmography for 240 min after oral gavage of 50 mg·kg−1 morphine or 0, 15, 30, or 60 mg·kg−1 RNE28 (n = 6 mice per group). (f) Place preference of mice for the drug compartment after 4 days of conditioning consisting in daily oral gavage with the vehicle in the control compartment and 15 mg·kg−1 morphine (n = 9 mice) or 0 (n = 12), 15 (n = 12), 30 (n = 12) or 60 (n = 12) mg·kg−1 RNE28 in the drug compartment. * P < 0.05 versus vehicle. Two‐way ANOVA followed by Dunnett's post hoc test (a), one‐way ANOVA followed by Dunnett's post hoc test (b, d, g) and Kruskal–Wallis followed by Dunn's post hoc test (c, f). n numbers represent mice
