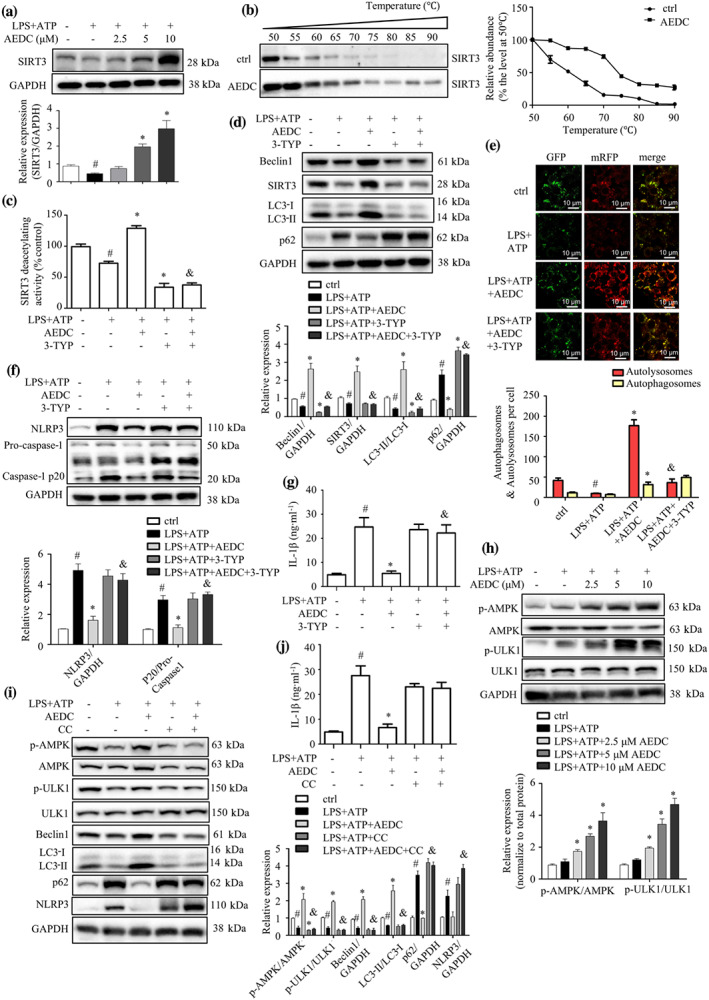
FIGURE 3.

AEDC suppressed IL‐1β production and NLRP3 inflammasome activation by SIRT3‐AMPK‐mediated autophagy. (a) THP‐1 cells were treated with different concentrations of AEDC for 12 h, followed by stimulation with LPS for 4 h and then ATP for 1 h. Expression of SIRT3 was detected by Western blotting (n = 6). GAPDH was used as an internal loading control. Data were normalized to the mean value of the control group. (b) CETSA was performed on THP‐1 cells treated with or without 10 μM AEDC for 12 h. Data were normalized to the mean value of the respective group at 50°C (n = 5). THP‐1 cells were treated with or without 10 μM AEDC for 12 h and 50 μM 3‐TYP for 6 h, followed by stimulation with LPS for 4 h and then ATP for 1 h. (c) The SIRT3 deacetylating activity was evaluated. Data were normalized to the mean value of the control group (n = 6). (d) Expression of autophagy‐related proteins was detected by Western blotting (n = 5). GAPDH was used as an internal loading control. Data were normalized to the mean value of the control group. (e) THP‐1 cells were transiently infected with the mRFP‐GFP‐LC3 lentivirus for 24 h. mRFP‐GFP‐LC3 puncta were measured using a confocal microscope (n = 5). Scale bar = 10 μm. (f) NLRP3 and caspase‐1 in the cell lysates were detected by Western blotting (n = 5). GAPDH was used as an internal loading control. Data were normalized to the mean value of the control group. (g) The level of IL‐1β in the cell culture medium was determined by ELISA, in THP‐1 cells treated with or without 10 μM AEDC for 12 h and 50 μM 3‐TYP for 6 h, followed by stimulation of LPS for 18 h and ATP for 1 h (n = 6). Data are expressed as means ± SEM. # P < 0.05 LPS + ATP vs. ctrl; *P < 0.05 LPS + ATP + AEDC (3‐TYP) vs. LPS + ATP; & P < 0.05 LPS + ATP + AEDC vs. LPS + ATP + AEDC + 3‐TYP. (h) THP‐1 cells were treated with or without different concentrations of AEDC for 12 h, followed by stimulation with LPS for 4 h and then ATP for 1 h. p‐AMPK, AMPK, p‐ULK1 and ULK1 were detected by Western blotting (n = 6). GAPDH was used as an internal loading control. Data were normalized to the mean value of the control group. (i) THP‐1 cells were treated with or without 10 μM AEDC for 12 h and 4 μM compound C (CC) for 6 h, followed by stimulation with LPS for 4 h and then ATP for 1 h. The expression of autophagy‐related proteins was examined by Western blotting (n = 6). GAPDH was used as an internal loading control. Data were normalized to the mean value of the control group. (j) The level of IL‐1β in the culture medium was determined by ELISA, in THP‐1 cells treated with or without 10 μM AEDC for 12 h and 4 μM CC for 6 h, followed by stimulation of LPS for 18 h and ATP for 1 h (n = 6). Data are expressed as means ± SEM. # P < 0.05 LPS + ATP vs. ctrl; *P < 0.05 LPS + ATP + AEDC (CC) vs. LPS + ATP; & P < 0.05 LPS + ATP + AEDC vs. LPS + ATP + AEDC + CC
