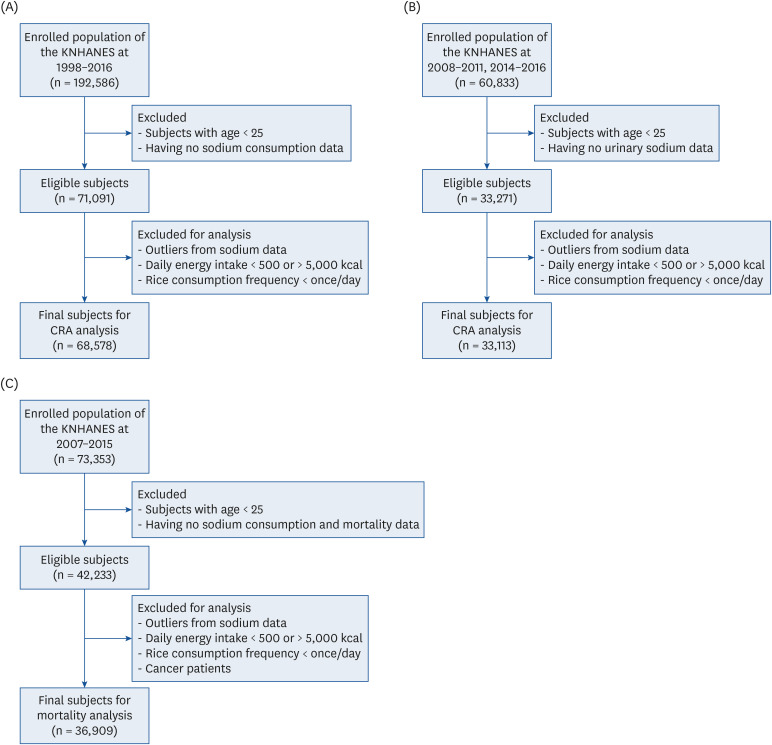
Fig. 1. Flow chart of study subject selection for the CRA analysis and mortality association analysis. The number of study participants were represented as a range because there were differences in survey questionnaire and number of participants every year. (A) Flow chart for CRA analysis about dietary sodium intake. (B) Flow chart for CRA analysis about urinary sodium excretion. Urinary sodium excretion was only available in 2008–2011 and 2014–2016. (C) Flow chart for mortality association analysis about dietary sodium intake. Mortality data were available in 2007–2015.
KNHANES, Korea National Health and Nutrition Examination Survey; CRA, comparative risk assessment.

