
Fig. 2.
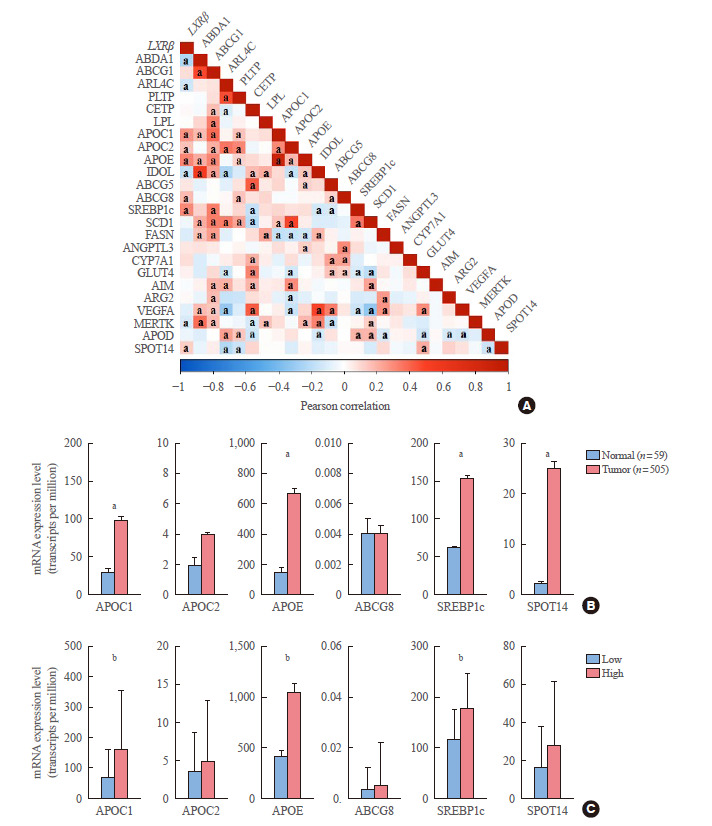
Correlation analysis between expression of liver X receptor β (LXRβ) and its transcriptional target genes. (A) Correlation between expression of LXRβ and its transcriptional target genes in The Cancer Genome Atlas (TCGA) thyroid carcinoma (THCA). Correlation coefficients were calculated by Pearson’s method. (B) Comparison of mRNA expression level of LXRβ representative target genes between normal and cancer tissues in TCGA THCA. (C) Comparison of mRNA expression level of LXRβ representative target genes according to LXRβ expression status (n=126 for each group). Data are presented as mean±standard deviation. Mean comparisons were analyzed by an unpaired t test. APOC1, apolipoprotein C1; APOC2, apolipoprotein C2; APOE, apolipoprotein E; ABCG8, ATP binding cassette subfamily G member 8; SREBP1c, sterol regulatory element-binding protein 1c; SPOT14, thyroid hormone responsive (THRSP). a P<0.01; b P<0.0001.