
Fig. 4.
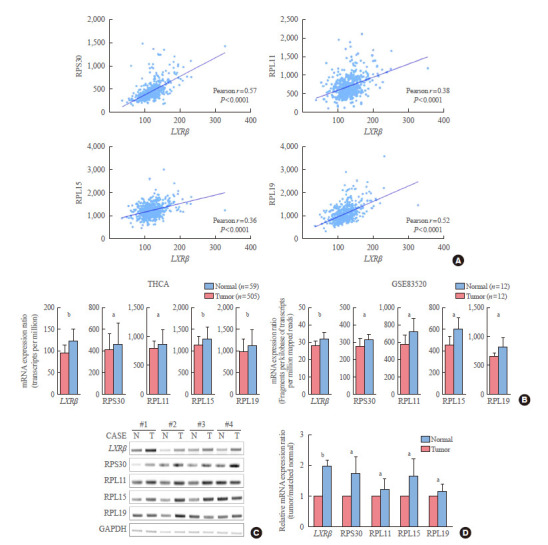
Positive relationship of liver X receptor β (LXRβ) with the expression of representative ribosome genes. (A) Correlation analysis of LXRβ with representative ribosome genes (n=505, using thyroid carcinoma [THCA] data). Correlation coefficients were calculated by Pearson’s method. P values are indicated on the corresponding figures. (B) Selected target gene expressions were identified in THCA and GSE83520 data sets. GSE83520 is the data that performed RNA sequencing with the tumor and normal tissues of 12 papillary thyroid carcinoma patients. (C) Representative figure of reverse transcription-polymerase chain reaction (RT-PCR) validating THCA analysis using our validation samples. All RT-PCR assays were representative of at least three independent experiments. (D) Semi-quantitative analysis of RT-PCR results (each group n=8) using ImageJ software. Data are presented as mean±standard deviation. Mean comparisons were analyzed by Wilcoxon signed rank test. All experiments were repeated three times, and each experiment was performed in triplicate. N, normal; T, tumor; RPS30, ribosomal protein S30; RPL11, ribosomal protein L11; RPL15, ribosomal protein L15; RPL19, ribosomal protein L19; GAPDH, glyceraldehyde-3-phosphate dehydrogenase. a P<0.05; b P<0.001.