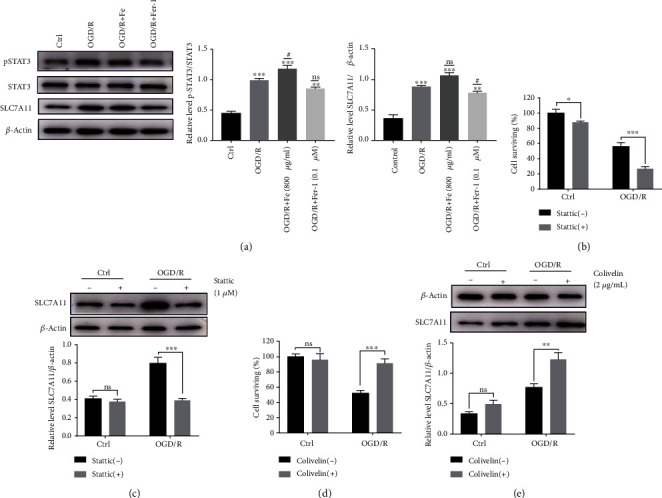
Figure 5.

pSTAT3 upregulates SLC7A11in OGD/R-induced MLE12 ferroptosis. (a) The level of SLC7A11, STAT3, and pSTAT3 expression was detected by western blot. The intensity of pSTAT3 was normalized to the corresponding level of STAT3. The intensity of SLC7A11 was normalized to the corresponding level of β-actin, and the changes are shown in the histograms. ∗P < .05, ∗∗P < .01, ∗∗∗P < .001, #P < .05, ##P < .01, and ###P < .001 between the groups. ∗Compared with the control group. #Compared with the OGD/R group. (b) The cell proliferation activity was measured with a CCK8 assay after OGD/R and treated with pharmacologic blockade of STAT3 phosphorylation. (c) The relative level of SLC7A11 protein expression after inhibition of STAT3 phosphorylation. The SLC7A11 intensity was normalized to the corresponding level of β-actin, and the changes are shown in the histograms. ∗P < .05, ∗∗P < .01, and ∗∗∗P < .001 between the groups. (d) The cell proliferation activity was measured with a CCK8 assay after OGD/R and treated with pharmacologic activation of STAT3 phosphorylation. (e) The relative level of SLC7A11 protein expression after activation of STAT3 phosphorylation. The SLC7A11 intensity was normalized to the corresponding level of β-actin, and the changes are shown in the histograms. ∗P < .05, ∗∗P < .01, and ∗∗∗P < .001 between the groups.
